

ESTONIAN ENVIRONMENTAL REVIEW 2009
ESTONIAN ENVIRONMENTAL REVIEW 2009
ESTONIAN ENVIRONMENTAL REVIEW 2009

You also want an ePaper? Increase the reach of your titles
YUMPU automatically turns print PDFs into web optimized ePapers that Google loves.
2.6. Agriculture<br />
The relative importance of agriculture in the Estonian<br />
economy has declined since the mid-1990s and<br />
the competitiveness of our agriculture sector is below<br />
the EU average, although a large part of the foodstuffs<br />
consumed in Estonia are grown on the spot. Agricultural<br />
production is one of the most characteristic activities in<br />
Estonia’s rural areas. Agriculture supplies Estonians with<br />
food, offers work in rural areas and shapes the cultural<br />
landscape.<br />
Animal husbandry<br />
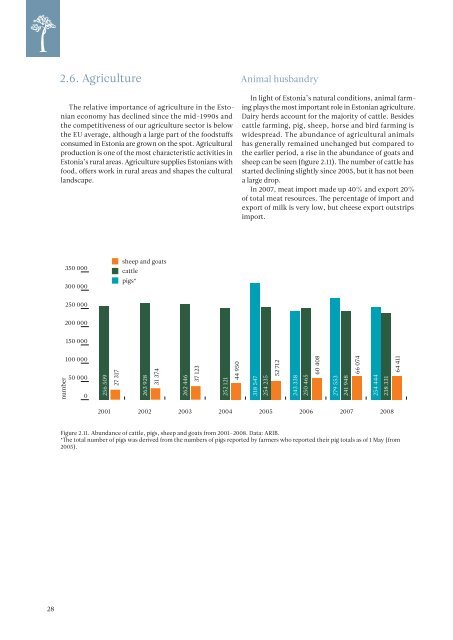
In light of Estonia’s natural conditions, animal farming<br />
plays the most important role in Estonian agriculture.<br />
Dairy herds account for the majority of cattle. Besides<br />
cattle farming, pig, sheep, horse and bird farming is<br />
widespread. The abundance of agricultural animals<br />
has generally remained unchanged but compared to<br />
the earlier period, a rise in the abundance of goats and<br />
sheep can be seen (figure 2.11). The number of cattle has<br />
started declining slightly since 2005, but it has not been<br />
a large drop.<br />
In 2007, meat import made up 40% and export 20%<br />
of total meat resources. The percentage of import and<br />
export of milk is very low, but cheese export outstrips<br />
import.<br />
350 000<br />
300 000<br />
sheep and goats<br />
cattle<br />
pigs*<br />
250 000<br />
200 000<br />
150 000<br />
number<br />
100 000<br />
50 000<br />
0<br />
256 509<br />
27 317<br />
263 928<br />
31 374<br />
262 446<br />
37 123<br />
252 121<br />
44 950<br />
318 547<br />
254 235<br />
52 712<br />
243 338<br />
250 465<br />
60 408<br />
279 553<br />
241 948<br />
66 074<br />
254 444<br />
238 331<br />
64 411<br />
2001 2002 2003 2004 2005 2006 2007 2008<br />
Figure 2.11. Abundance of cattle, pigs, sheep and goats from 2001–2008. Data: ARIB.<br />
*The total number of pigs was derived from the numbers of pigs reported by farmers who reported their pig totals as of 1 May (from<br />
2005).<br />
28


