

ESTONIAN ENVIRONMENTAL REVIEW 2009
ESTONIAN ENVIRONMENTAL REVIEW 2009
ESTONIAN ENVIRONMENTAL REVIEW 2009

Create successful ePaper yourself
Turn your PDF publications into a flip-book with our unique Google optimized e-Paper software.
25 000<br />
pine<br />
spruce<br />
birch<br />
aspen<br />
common alder<br />
grey alder<br />
other<br />
20 000<br />
15 000<br />
10 000<br />
5 000<br />
km 2<br />
0<br />
1999<br />
2000<br />
2001 2002 2003 2004 2005 2006 2007<br />
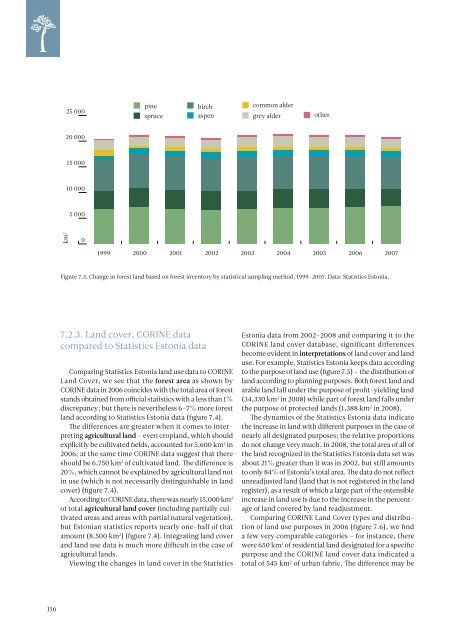
Figure 7.3. Change in forest land based on forest inventory by statistical sampling method, 1999–2007. Data: Statistics Estonia.<br />
7.2.3. Land cover, CORINE data<br />
compared to Statistics Estonia data<br />
Comparing Statistics Estonia land use data to CORINE<br />
Land Cover, we see that the forest area as shown by<br />
CORINE data in 2006 coincides with the total area of forest<br />
stands obtained from official statistics with a less than 1%<br />
discrepancy; but there is nevertheless 6–7% more forest<br />
land according to Statistics Estonia data (figure 7.4).<br />
The differences are greater when it comes to interpreting<br />
agricultural land – even cropland, which should<br />
explicitly be cultivated fields, accounted for 5,600 km 2 in<br />
2006; at the same time CORINE data suggest that there<br />
should be 6,750 km 2 of cultivated land. The difference is<br />
20%, which cannot be explained by agricultural land not<br />
in use (which is not necessarily distinguishable in land<br />
cover) (figure 7.4).<br />
According to CORINE data, there was nearly 15,000 km 2<br />
of total agricultural land cover (including partially cultivated<br />
areas and areas with partial natural vegetation),<br />
but Estonian statistics reports nearly one-half of that<br />
amount (8,500 km 2 ) (figure 7.4). Integrating land cover<br />
and land use data is much more difficult in the case of<br />
agricultural lands.<br />
Viewing the changes in land cover in the Statistics<br />
Estonia data from 2002–2008 and comparing it to the<br />
CORINE land cover database, significant differences<br />
become evident in interpretations of land cover and land<br />
use. For example, Statistics Estonia keeps data according<br />
to the purpose of land use (figure 7.5) – the distribution of<br />
land according to planning purposes. Both forest land and<br />
arable land fall under the purpose of profit-yielding land<br />
(34,330 km 2 in 2008) while part of forest land falls under<br />
the purpose of protected lands (1,388 km 2 in 2008).<br />
The dynamics of the Statistics Estonia data indicate<br />
the increase in land with different purposes in the case of<br />
nearly all designated purposes; the relative proportions<br />
do not change very much. In 2008, the total area of all of<br />
the land recognized in the Statistics Estonia data set was<br />
about 21% greater than it was in 2002, but still amounts<br />
to only 84% of Estonia’s total area. The data do not reflect<br />
unreadjusted land (land that is not registered in the land<br />
register), as a result of which a large part of the ostensible<br />
increase in land use is due to the increase in the percentage<br />
of land covered by land readjustment.<br />
Comparing CORINE Land Cover types and distribution<br />
of land use purposes in 2006 (figure 7.6), we find<br />
a few very comparable categories – for instance, there<br />
were 650 km 2 of residential land designated for a specific<br />
purpose and the CORINE land cover data indicated a<br />
total of 545 km 2 of urban fabric. The difference may be<br />
116


