

ESTONIAN ENVIRONMENTAL REVIEW 2009
ESTONIAN ENVIRONMENTAL REVIEW 2009
ESTONIAN ENVIRONMENTAL REVIEW 2009

Create successful ePaper yourself
Turn your PDF publications into a flip-book with our unique Google optimized e-Paper software.
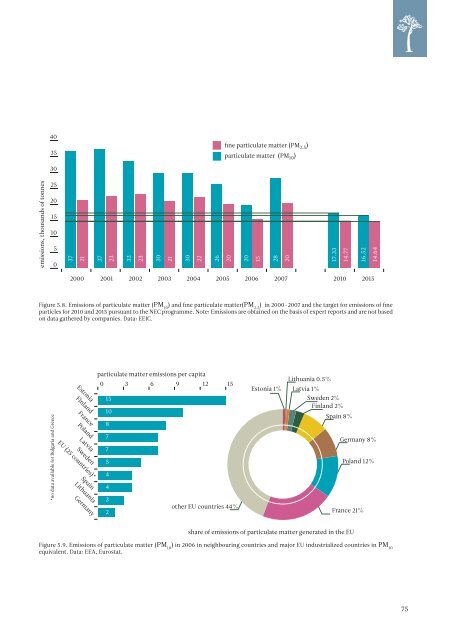
40<br />
35<br />
fine particulate matter (PM 2.5 )<br />
particulate matter (PM 10 )<br />
30<br />
emissions, thousands of tonnes<br />
25<br />
20<br />
15<br />
10<br />
5<br />
0<br />
37<br />
21<br />
37<br />
23<br />
33<br />
23<br />
30<br />
21<br />
30<br />
22<br />
26<br />
20<br />
20<br />
15<br />
28<br />
20<br />
17.33<br />
14.77<br />
16.52<br />
14.64<br />
2000 2001 2002 2003 2004 2005 2006 2007 2010 2015<br />
Figure 5.8. Emissions of particulate matter (PM 10<br />
) and fine particulate matter(PM 2.5<br />
) in 2000–2007 and the target for emissions of fine<br />
particles for 2010 and 2015 pursuant to the NEC programme. Note: Emissions are obtained on the basis of expert reports and are not based<br />
on data gathered by companies. Data: EEIC.<br />
Estonia<br />
Finland<br />
France<br />
Poland<br />
Latvia<br />
Sweden<br />
EU (25 countries)*<br />
Spain<br />
Lithuania<br />
Germany<br />
*no data available for Bulgaria and Greece<br />
particulate matter emissions per capita<br />
0 3 6 9 12 15<br />
15<br />
10<br />
8<br />
7<br />
7<br />
5<br />
4<br />
4<br />
3<br />
2<br />
other EU countries 44%<br />
Lithuania 0.5%<br />
Estonia 1% Latvia 1%<br />
Sweden 2%<br />
Finland 2%<br />
Spain 8%<br />
Germany 8%<br />
Poland 12%<br />
France 21%<br />
share of emissions of particulate matter generated in the EU<br />
Figure 5.9. Emissions of particulate matter (PM 10<br />
) in 2006 in neighbouring countries and major EU industrialized countries in PM 10<br />
equivalent. Data: EEA, Eurostat.<br />
75


