

ESTONIAN ENVIRONMENTAL REVIEW 2009
ESTONIAN ENVIRONMENTAL REVIEW 2009
ESTONIAN ENVIRONMENTAL REVIEW 2009

Create successful ePaper yourself
Turn your PDF publications into a flip-book with our unique Google optimized e-Paper software.
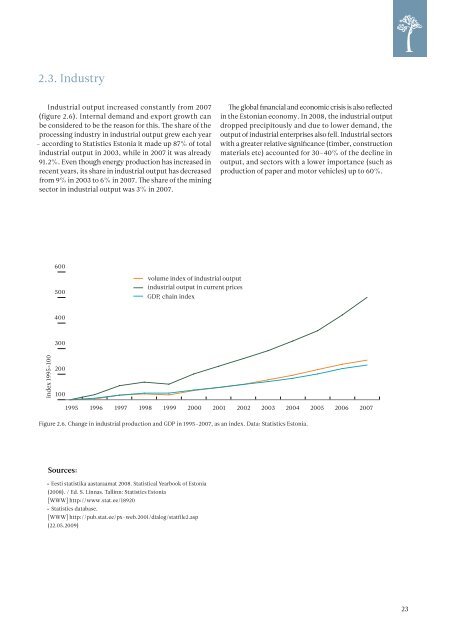
2.3. Industry<br />
Industrial output increased constantly from 2007<br />
(figure 2.6). Internal demand and export growth can<br />
be considered to be the reason for this. The share of the<br />
processing industry in industrial output grew each year<br />
– according to Statistics Estonia it made up 87% of total<br />
industrial output in 2003, while in 2007 it was already<br />
91.2%. Even though energy production has increased in<br />
recent years, its share in industrial output has decreased<br />
from 9% in 2003 to 6% in 2007. The share of the mining<br />
sector in industrial output was 3% in 2007.<br />
The global financial and economic crisis is also reflected<br />
in the Estonian economy. In 2008, the industrial output<br />
dropped precipitously and due to lower demand, the<br />
output of industrial enterprises also fell. Industrial sectors<br />
with a greater relative significance (timber, construction<br />
materials etc) accounted for 30–40% of the decline in<br />
output, and sectors with a lower importance (such as<br />
production of paper and motor vehicles) up to 60%.<br />
600<br />
500<br />
volume index of industrial output<br />
industrial output in current prices<br />
GDP, chain index<br />
400<br />
300<br />
index 1995=100<br />
200<br />
100<br />
1995 1996 1997 1998 1999 2000 2001 2002 2003 2004 2005 2006 2007<br />
Figure 2.6. Change in industrial production and GDP in 1995–2007, as an index. Data: Statistics Estonia.<br />
Sources:<br />
• Eesti statistika aastaraamat 2008. Statistical Yearbook of Estonia<br />
(2008). / Ed. S. Linnas. Tallinn: Statistics Estonia<br />
[WWW] http://www.stat.ee/18920<br />
• Statistics database.<br />
[WWW] http://pub.stat.ee/px-web.2001/dialog/statfile2.asp<br />
(22.05.<strong>2009</strong>)<br />
23


