- Page 1: Estonian Environment ESTONIAN ENVIR
- Page 4 and 5: Published in the “Estonian Enviro
- Page 6 and 7: Table of contents Foreword 3 Introd
- Page 8 and 9: 10. The environment and health 162
- Page 10 and 11: Summary Socioeconomic background In
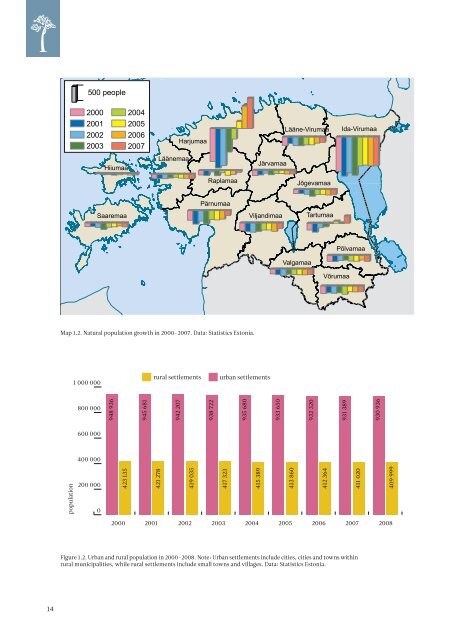
- Page 12: Part 1 Socioeconomic background 1.
- Page 15: 1 600 000 1 550 000 1 500 000 popul
- Page 20 and 21: 2. The economy Estonia’s economy
- Page 22 and 23: Table 2.3. GDP per capita as measur
- Page 24 and 25: agriculture and fishery 3%, 3859 pr
- Page 26 and 27: 2.4. Transport Transport gives peop
- Page 28 and 29: 2.5. Tourism After independence was
- Page 30 and 31: 2.6. Agriculture The relative impor
- Page 32 and 33: Fertilizer use With regard to inorg
- Page 34 and 35: Agri-environmental support monitori
- Page 36: 3. Natural resources
- Page 39 and 40: Construction mineral resources were
- Page 41 and 42: 10000 thousands of cubic metres 800
- Page 43 and 44: Status of fish stocks in inland bod
- Page 45 and 46: 3.2.3. Restocking As a consequence
- Page 47 and 48: Map 3.2. Average volume per hectare
- Page 49 and 50: 15 increment felling volume optimum
- Page 51 and 52: 3.3.5. Forest fires One of the exte
- Page 53 and 54: 3.4. Hunting Hunting is closely rel
- Page 55 and 56: 20 000 population size hunting bag
- Page 58 and 59: 4. Weather patterns and causes of c
- Page 60 and 61: o C Ristna -22.9/-28.4 Vilsandi -21
- Page 62 and 63: 4.2. Greenhouse gas emissions and o
- Page 64 and 65: agriculture 6% waste 3% industrial
- Page 66 and 67:
According to Statistics Estonia, CF
- Page 68:
5. Ambient air
- Page 71 and 72:
5.2. Emissions 5.2.1. Emissions of
- Page 73 and 74:
5.2.2. Tropospheric ozone precursor
- Page 75 and 76:
Finland Bulgaria Spain Latvia tropo
- Page 77 and 78:
40 35 fine particulate matter (PM 2
- Page 79 and 80:
other mobile pollution sources 0.04
- Page 81 and 82:
6 5 4 3 2 tonnes 1 0 5.66 5.41 4.30
- Page 83 and 84:
Compared to years past, the number
- Page 85 and 86:
Hiiumaa 100 89 Saaremaa Läänemaa
- Page 88 and 89:
6. Water The existence of clean fre
- Page 90 and 91:
300 250 30 agriculture 200 13 manuf
- Page 92 and 93:
6.2.2. Mining and cooling water In
- Page 94 and 95:
250 wastewater volume total phospho
- Page 96 and 97:
Tallinn Kohtla-Järve Rakvere Tartu
- Page 98 and 99:
6.4. Status of water 6.4.1. Groundw
- Page 100 and 101:
6.4.2. Evaluating the status of sur
- Page 102 and 103:
6.4.4. Status of rivers Proceeding
- Page 104 and 105:
Hirve Imsi Pale Uia Keila_1 Neeva S
- Page 106 and 107:
6.4.5. Status of lakes The ecologic
- Page 108:
7. Soil and land use
- Page 111 and 112:
7.1.2. Soil formation Soil is creat
- Page 113 and 114:
7.1.4. Soil status The status of so
- Page 115 and 116:
7.2. Changes in land use 7.2.1. Cha
- Page 117 and 118:
7.2.2. Changes in land use as refle
- Page 119 and 120:
partly attributable to unrealized p
- Page 121 and 122:
7.3. Urban sprawl Suburban sprawl i
- Page 123 and 124:
green network core areas and corrid
- Page 126 and 127:
8. Biological diversity Considering
- Page 128 and 129:
Table 8.2 Abundance and trends for
- Page 130 and 131:
Species habitats The status of habi
- Page 132 and 133:
non-initiation of Natura environmen
- Page 134 and 135:
8.2.3. Achieving protection of biol
- Page 136 and 137:
Management plans Currently there ar
- Page 138 and 139:
8.3. Inland water bodies The divers
- Page 140 and 141:
Small lakes The equilibrium of smal
- Page 142 and 143:
8.4.2. Species: seals With the mild
- Page 144 and 145:
Proliferation of macroalgae Costal
- Page 146:
9. Waste
- Page 149 and 150:
20 total waste generated hazardous
- Page 151 and 152:
9.4. Municipal waste generation and
- Page 153 and 154:
The primary reasons for the delay a
- Page 155 and 156:
2004 2006 80 2005 2007 target of 15
- Page 157 and 158:
9.8. Recovery of waste Recovery of
- Page 159 and 160:
deposition in landfills other dispo
- Page 161 and 162:
Table 9.2. Number of landfills in 2
- Page 164 and 165:
10. The environment and health The
- Page 166 and 167:
a deficiency in the technical condi
- Page 168:
11. Economic instruments for enviro
- Page 171 and 172:
and payment, rates and use of the s
- Page 173 and 174:
tion, environmental educational ini
- Page 176 and 177:
12. Environmental management tools
- Page 178 and 179:
12.3. Environmental labels Consumer
- Page 180:
Appendix
- Page 183 and 184:
year month, day place event indicat
- Page 185 and 186:
Abbreviations used ARC - Agricultur