

ESTONIAN ENVIRONMENTAL REVIEW 2009
ESTONIAN ENVIRONMENTAL REVIEW 2009
ESTONIAN ENVIRONMENTAL REVIEW 2009

You also want an ePaper? Increase the reach of your titles
YUMPU automatically turns print PDFs into web optimized ePapers that Google loves.
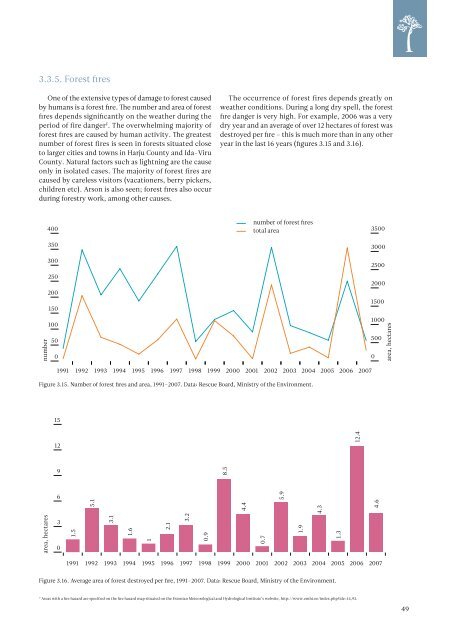
3.3.5. Forest fires<br />
One of the extensive types of damage to forest caused<br />
by humans is a forest fire. The number and area of forest<br />
fires depends significantly on the weather during the<br />
period of fire danger F . The overwhelming majority of<br />
forest fires are caused by human activity. The greatest<br />
number of forest fires is seen in forests situated close<br />
to larger cities and towns in Harju County and Ida-Viru<br />
County. Natural factors such as lightning are the cause<br />
only in isolated cases. The majority of forest fires are<br />
caused by careless visitors (vacationers, berry pickers,<br />
children etc). Arson is also seen; forest fires also occur<br />
during forestry work, among other causes.<br />
The occurrence of forest fires depends greatly on<br />
weather conditions. During a long dry spell, the forest<br />
fire danger is very high. For example, 2006 was a very<br />
dry year and an average of over 12 hectares of forest was<br />
destroyed per fire – this is much more than in any other<br />
year in the last 16 years (figures 3.15 and 3.16).<br />
number<br />
400<br />
350<br />
300<br />
250<br />
200<br />
150<br />
100<br />
50<br />
0<br />
number of forest fires<br />
total area<br />
3500<br />
3000<br />
2500<br />
2000<br />
1500<br />
1000<br />
500<br />
0<br />
area, hectares<br />
1991 1992 1993 1994 1995 1996 1997 1998 1999 2000 2001 2002 2003 2004 2005 2006 2007<br />
Figure 3.15. Number of forest fires and area, 1991–2007. Data: Rescue Board, Ministry of the Environment.<br />
15<br />
12<br />
12.4<br />
9<br />
6<br />
5.1<br />
8.5<br />
4.4<br />
5.9<br />
4.3<br />
area, hectares<br />
4.6<br />
3<br />
0<br />
1.5<br />
3.1<br />
1.6<br />
1<br />
2.1<br />
3.2<br />
0.9<br />
0.7<br />
1.9<br />
1.3<br />
1991 1992 1993 1994 1995 1996 1997 1998 1999 2000 2001 2002 2003 2004 2005 2006 2007<br />
Figure 3.16. Average area of forest destroyed per fire, 1991–2007. Data: Rescue Board, Ministry of the Environment.<br />
F<br />
Areas with a fire hazard are specified on the fire hazard map situated on the Estonian Meteorological and Hydrological Institute’s website, http://www.emhi.ee/index.php?ide=14,93.<br />
49


