

ESTONIAN ENVIRONMENTAL REVIEW 2009
ESTONIAN ENVIRONMENTAL REVIEW 2009
ESTONIAN ENVIRONMENTAL REVIEW 2009

You also want an ePaper? Increase the reach of your titles
YUMPU automatically turns print PDFs into web optimized ePapers that Google loves.
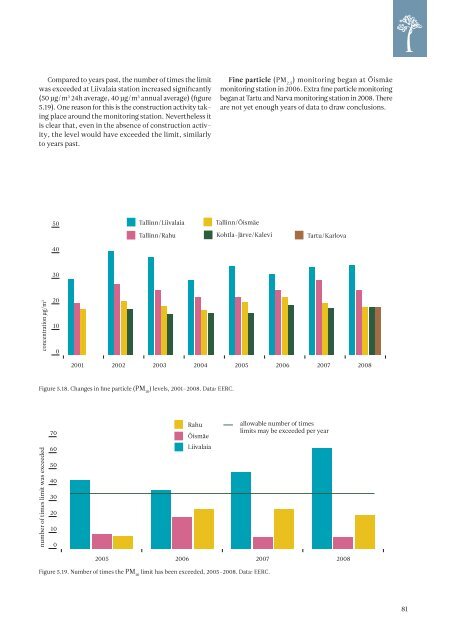
Compared to years past, the number of times the limit<br />
was exceeded at Liivalaia station increased significantly<br />
(50 µg/m 3 24h average, 40 µg/m 3 annual average) (figure<br />
5.19). One reason for this is the construction activity taking<br />
place around the monitoring station. Nevertheless it<br />
is clear that, even in the absence of construction activity,<br />
the level would have exceeded the limit, similarly<br />
to years past.<br />
Fine particle (PM 2.5<br />
) monitoring began at Õismäe<br />
monitoring station in 2006. Extra fine particle monitoring<br />
began at Tartu and Narva monitoring station in 2008. There<br />
are not yet enough years of data to draw conclusions.<br />
50<br />
Tallinn/Liivalaia<br />
Tallinn/Õismäe<br />
Tallinn/Rahu<br />
Kohtla-Järve/Kalevi<br />
Tartu/Karlova<br />
40<br />
30<br />
concentration μg/m 3<br />
20<br />
10<br />
0<br />
2001 2002 2003 2004 2005 2006 2007 2008<br />
Figure 5.18. Changes in fine particle (PM 10<br />
) levels, 2001–2008. Data: EERC.<br />
number of times limit was exceeded<br />
70<br />
60<br />
50<br />
40<br />
30<br />
20<br />
10<br />
0<br />
Rahu<br />
Õismäe<br />
Liivalaia<br />
allowable number of times<br />
limits may Tallinn/Õismäe<br />
be exceeded per year<br />
Tallinn/Rahu Tartu/Karlova<br />
Tallinn/Liivalaia Kohtla-Järve/Kalevi<br />
2005 2006 2007 2008<br />
Figure 5.19. Number of times the PM 10<br />
limit has been exceeded, 2005–2008. Data: EERC.<br />
80<br />
81


