

ESTONIAN ENVIRONMENTAL REVIEW 2009
ESTONIAN ENVIRONMENTAL REVIEW 2009
ESTONIAN ENVIRONMENTAL REVIEW 2009

Create successful ePaper yourself
Turn your PDF publications into a flip-book with our unique Google optimized e-Paper software.
9.5. Packaging waste<br />
The adoption of the new Packaging Act on 21 April<br />
2004 laid the foundation for collection of packaging waste<br />
and establishment of a nationwide system for recovery of<br />
packaging waste. To achieve the goals of the Packaging<br />
Act, a new economic measure was implemented as of 1<br />
May 2005 – (a) the obligation to accept back all packages<br />
– and (b) deposits were established for a number of<br />
beverage containers. Effective 1 July 2005, a packaging<br />
excise duty came into effect for sales packaging other than<br />
alcohol and beverages, to be applied if packaging is not<br />
recovered in the quantity specified in legislation.<br />
The rapid economic growth seen up to 2008 significantly<br />
increased consumer spending on goods, as a result<br />
of which quantities of packaging waste increased each year<br />
as well. Whereas in 2001 the amount of packaging waste<br />
generated in Estonia was estimated at 110,000 tonnes, in<br />
2007 the figure had already grown to 162,000 tonnes.<br />
In 2007–2008, a study C commissioned by the Ministry<br />
of the Environment examined sorting of municipal<br />
waste, and also studied separately what kinds of packaging<br />
waste were found in municipal waste. The results<br />
showed that plastic packaging made up the greatest share<br />
of the packaging waste, of which an average of 65% was<br />
soft plastic (plastic bags, plastic film etc). Hard plastic<br />
(plastic bottles, boxes, lids, caps etc) made up an average<br />
of 35% of plastic packaging. Glass packaging and paper<br />
and cardboard packaging made up an approximately<br />
equal share of packaging waste. A positive sign noted<br />
was the fact that the percentage of beverage packaging<br />
with deposits (returnable packaging) was very small. This<br />
points to the fact that the deposit system for packaging<br />
is functioning effectively.<br />
The high percentage of packaging waste in municipal<br />
waste is a problem in many countries. It is also one reason<br />
that in 1994 the European Union Packaging and Packaging<br />
Waste Directive was adopted (94/62/EU). It established<br />
the basic requirements and objectives in the field of<br />
packaging including targets for recovery of packaging<br />
waste; these requirements and targets were also adopted<br />
in the Packaging Act. Pursuant to the Packaging Act an<br />
undertaking engaged in packaging of goods or importing<br />
packaged goods must ensure recovery of packaging waste<br />
in the following extent as of 1 May 2004:<br />
• at least 50% a year of the total mass<br />
of packaging waste;<br />
• at least 25% of the total mass of packaging waste<br />
must be recycled a year along with at least 15% of<br />
the total mass of each packaging material.<br />
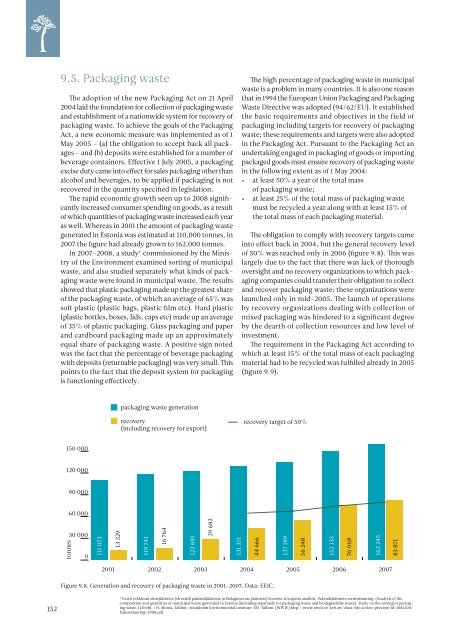
The obligation to comply with recovery targets came<br />
into effect back in 2004, but the general recovery level<br />
of 50% was reached only in 2006 (figure 9.8). This was<br />
largely due to the fact that there was lack of thorough<br />
oversight and no recovery organizations to which packaging<br />
companies could transfer their obligation to collect<br />
and recover packaging waste; these organizations were<br />
launched only in mid-2005. The launch of operations<br />
by recovery organizations dealing with collection of<br />
mixed packaging was hindered to a significant degree<br />
by the dearth of collection resources and low level of<br />
investment.<br />
The requirement in the Packaging Act according to<br />
which at least 15% of the total mass of each packaging<br />
material had to be recycled was fulfilled already in 2005<br />
(figure 9.9).<br />
packaging waste generation<br />
recovery<br />
(including recovery for export)<br />
recovery target of 50%<br />
180180000<br />
150 000<br />
120 000<br />
120000<br />
90 000<br />
60 000<br />
60000<br />
tonnes<br />
30 000<br />
0<br />
111 073<br />
13 329<br />
119 741<br />
16 764<br />
123 681<br />
29 683<br />
131 371<br />
44 666<br />
137 189<br />
56 248<br />
152 135<br />
76 068<br />
162 245<br />
83 871<br />
0<br />
2001 2002 2003 2004<br />
2005 2006<br />
2007<br />
Figure 9.8. Generation and recovery of packaging waste in 2001–2007. Data: EEIC.<br />
152<br />
C<br />
Eestis tekkinud olmejäätmete (sh eraldi pakendijäätmete ja biolagunevate jäätmete) koostise ja koguste analüüs. Pakendijäätmete sortimisuuring. (Analysis of the<br />
composition and quantities of municipal waste generated in Estonia (including separately for packaging waste and biodegradable waste). Study on the sorting of packaging<br />
waste.) (2008). / H. Moora. Tallinn : Stockholm Environmental Institute, SEI-Tallinn. [WWW] http://www.envir.ee/orb.aw/class=file/action=preview/id=1085200/<br />
Pakendiuuring+2008.pdf


