- Page 1:
TECHNISCHE UNIVERSITÄT MÜNCHEN In
- Page 5 and 6:
Vorwort Die vorliegende Arbeit ents
- Page 7 and 8:
Kurzfassung Die vorliegende Arbeit
- Page 9 and 10:
Contents List of Figures List of Ta
- Page 11:
CONTENTS 5 Results 155 5.1 Droplets
- Page 14 and 15:
LIST OF FIGURES xiv 3.3 Droplet Arr
- Page 16 and 17:
LIST OF FIGURES 5.19 Progression of
- Page 18 and 19:
LIST OF TABLES C.2 Overview of Tele
- Page 20 and 21:
NOMENCLATURE g Gravitational force
- Page 22 and 23:
NOMENCLATURE σ S Surface tension N
- Page 24 and 25:
NOMENCLATURE () T Thermal, temperat
- Page 26 and 27:
NOMENCLATURE PAL PAN PDU PFA PFC PH
- Page 28 and 29:
1 Introduction In thermal engines t
- Page 30 and 31:
1 Introduction 1.3 Oxides of Nitrog
- Page 32 and 33:
1 Introduction residence time of th
- Page 34 and 35:
1 Introduction Chapter 3 describes
- Page 36 and 37:
2 Combustion Theory 2.1.1 Premixed
- Page 38 and 39:
2 Combustion Theory molecules by ea
- Page 40 and 41:
2 Combustion Theory four types. Out
- Page 42 and 43:
2 Combustion Theory ventional combu
- Page 44 and 45:
2 Combustion Theory of partial pre-
- Page 46 and 47:
2 Combustion Theory Formation of Fu
- Page 48 and 49:
2 Combustion Theory Moreover, exper
- Page 50 and 51:
2 Combustion Theory For the gas pha
- Page 52 and 53:
2 Combustion Theory combustion, ext
- Page 54 and 55:
2 Combustion Theory termed “natur
- Page 56 and 57:
2 Combustion Theory thin layer of u
- Page 58 and 59:
2 Combustion Theory nor generally c
- Page 60 and 61:
2 Combustion Theory is assumed to o
- Page 62 and 63:
2 Combustion Theory before it follo
- Page 64 and 65:
2 Combustion Theory position, which
- Page 66 and 67:
2 Combustion Theory 2.3 Kinetic Mod
- Page 68 and 69:
2 Combustion Theory 1.2 m s −1 La
- Page 70 and 71:
2 Combustion Theory Mole fraction o
- Page 72 and 73:
2 Combustion Theory Reburn Miller a
- Page 74 and 75:
2 Combustion Theory The results of
- Page 76 and 77:
2 Combustion Theory Temperature T 3
- Page 78 and 79:
2 Combustion Theory 0.0004 GRI 3.0
- Page 80 and 81:
2 Combustion Theory In conclusion,
- Page 83 and 84:
3 Experiments on Droplet Array Comb
- Page 85 and 86:
3.1 Droplet Combustion Facility and
- Page 87 and 88: 3.1 Droplet Combustion Facility C D
- Page 89 and 90: 3.1 Droplet Combustion Facility ous
- Page 91 and 92: 3.1 Droplet Combustion Facility for
- Page 93 and 94: 3.1 Droplet Combustion Facility par
- Page 95 and 96: 3.1 Droplet Combustion Facility The
- Page 97 and 98: 3.1 Droplet Combustion Facility a c
- Page 99 and 100: 3.1 Droplet Combustion Facility •
- Page 101 and 102: 3.1 Droplet Combustion Facility Tab
- Page 103 and 104: 3.1 Droplet Combustion Facility Fig
- Page 105 and 106: 3.2 Measurement Techniques and Data
- Page 107 and 108: 3.2 Measurement Techniques and Data
- Page 109 and 110: 3.2 Measurement Techniques and Data
- Page 111 and 112: 3.2 Measurement Techniques and Data
- Page 113 and 114: 3.2 Measurement Techniques and Data
- Page 115 and 116: 3.2 Measurement Techniques and Data
- Page 117 and 118: 3.2 Measurement Techniques and Data
- Page 119 and 120: 3.2 Measurement Techniques and Data
- Page 121 and 122: 3.2 Measurement Techniques and Data
- Page 123 and 124: 3.2 Measurement Techniques and Data
- Page 125 and 126: 3.2 Measurement Techniques and Data
- Page 127 and 128: 3.2 Measurement Techniques and Data
- Page 129 and 130: 3.2 Measurement Techniques and Data
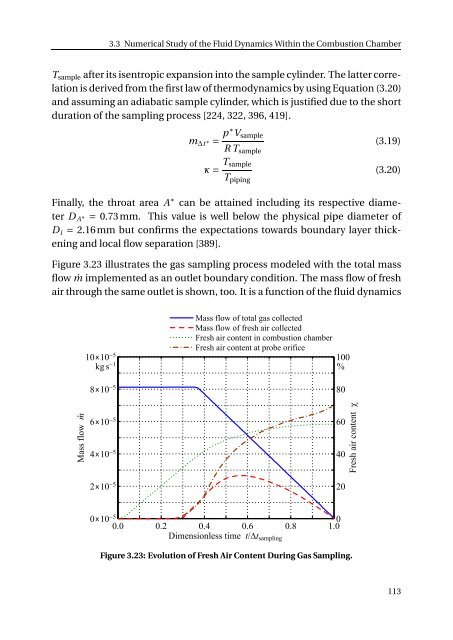
- Page 131 and 132: 3.3 Numerical Study of the Fluid Dy
- Page 133 and 134: 3.3 Numerical Study of the Fluid Dy
- Page 135 and 136: 3.3 Numerical Study of the Fluid Dy
- Page 137: 3.3 Numerical Study of the Fluid Dy
- Page 141 and 142: 3.3 Numerical Study of the Fluid Dy
- Page 143 and 144: 4 Numerical Modeling and Simulation
- Page 145 and 146: 4.2 Basics for Numerical Modeling 4
- Page 147 and 148: 4.2 Basics for Numerical Modeling 4
- Page 149 and 150: 4.2 Basics for Numerical Modeling n
- Page 151 and 152: 4.2 Basics for Numerical Modeling P
- Page 153 and 154: 4.2 Basics for Numerical Modeling E
- Page 155 and 156: 4.3 Modeling of Ignition In the end
- Page 157 and 158: 4.3 Modeling of Ignition 10 W Time
- Page 159 and 160: 4.3 Modeling of Ignition Hence, the
- Page 161 and 162: 4.4 Modeling of Nitrogen Oxide Form
- Page 163 and 164: 4.5 Simulation of Single Droplets t
- Page 165 and 166: 4.5 Simulation of Single Droplets e
- Page 167 and 168: 4.6 Model Validation with index i
- Page 169 and 170: 4.6 Model Validation utilized model
- Page 171 and 172: 4.6 Model Validation Figure 4.7 dep
- Page 173 and 174: 4.6 Model Validation 340 K Ambient
- Page 175 and 176: 4.6 Model Validation Table 4.1: Val
- Page 177 and 178: 4.7 Scope and Limitations of Single
- Page 179: 4.7 Scope and Limitations of Single
- Page 182 and 183: 5 Results In total, it includes 99
- Page 184 and 185: 5 Results atmosphere of Figure 5.1
- Page 186 and 187: 5 Results 32 g kg −1 2400 K Emiss
- Page 188 and 189:
5 Results 4.0 g kg −1 Emission in
- Page 190 and 191:
5 Results uses constant spatial pos
- Page 192 and 193:
5 Results 16 g kg −1 Emission ind
- Page 194 and 195:
5 Results Maximum temperature Tmax
- Page 196 and 197:
5 Results Even though the parameter
- Page 198 and 199:
5 Results Flame stand-off ratio ζ
- Page 200 and 201:
5 Results 5.2.3 Comparison with Mic
- Page 202 and 203:
5 Results 0.50 5000 ppm Emission in
- Page 204 and 205:
5 Results Ψ = 0.1695 (t Ψ = 5 s):
- Page 206 and 207:
5 Results 6.0 g kg −1 Emission in
- Page 208 and 209:
5 Results combustion in exhaust gas
- Page 210 and 211:
5 Results Flame stand-off ratio ζ
- Page 212 and 213:
5 Results D 0 being varied between
- Page 214 and 215:
5 Results 0.40 g kg −1 Initial dr
- Page 216 and 217:
5 Results A twofold trend was obser
- Page 218 and 219:
5 Results 5.6 Recommendations and F
- Page 221 and 222:
6 Summary and Conclusions In times
- Page 223:
APPENDIX
- Page 226 and 227:
A Chemical Mechanisms The earliest
- Page 228 and 229:
A Chemical Mechanisms only deduced
- Page 230 and 231:
A Chemical Mechanisms Another, very
- Page 232 and 233:
A Chemical Mechanisms the reactions
- Page 234 and 235:
B Investigated Conditions There are
- Page 236 and 237:
B Investigated Conditions Table B.1
- Page 238 and 239:
B Investigated Conditions high mech
- Page 240 and 241:
C Design Details of Experiment Equi
- Page 242 and 243:
C Design Details of Experiment Equi
- Page 244 and 245:
C Design Details of Experiment Equi
- Page 246 and 247:
C Design Details of Experiment Equi
- Page 248 and 249:
C Design Details of Experiment Equi
- Page 250 and 251:
D Raw Data of Microgravity Experime
- Page 252 and 253:
D Raw Data of Microgravity Experime
- Page 254 and 255:
D Raw Data of Microgravity Experime
- Page 256 and 257:
SUPERVISED THESES Student Sebastian
- Page 259 and 260:
References [1] J.A. Aardenne van, G
- Page 261 and 262:
REFERENCES [20] K. Annamalai and W.
- Page 263 and 264:
REFERENCES [39] C.H. Beck, R. Koch,
- Page 265 and 266:
REFERENCES [60] F. Buda, R. Bounace
- Page 267 and 268:
REFERENCES [80] Comsol AB (Stockhol
- Page 269 and 270:
REFERENCES [102] D.L. Dietrich, P.M
- Page 271 and 272:
REFERENCES [124] R. Ennetta, M. Ham
- Page 273 and 274:
REFERENCES [146] A.G. Gaydon and H.
- Page 275 and 276:
REFERENCES [167] M.P. Halstead, L.J
- Page 277 and 278:
REFERENCES [187] K.J. Hughes, T. Tu
- Page 279 and 280:
REFERENCES [207] M. Kikuchi, N. Sug
- Page 281 and 282:
REFERENCES [229] N.M. Laurendeau. F
- Page 283 and 284:
REFERENCES [253] A. Liñán and F.A
- Page 285 and 286:
REFERENCES [273] R.D. Matthews, R.F
- Page 287 and 288:
REFERENCES [293] K.G. Moesl, T. Sat
- Page 289 and 290:
REFERENCES [312] V. Nayagam, J.B. H
- Page 291 and 292:
REFERENCES [333] PCB Piezotronics,
- Page 293 and 294:
REFERENCES [353] K.K. Rink and A.H.
- Page 295 and 296:
REFERENCES [374] T. Sano. NO 2 Form
- Page 297 and 298:
REFERENCES [395] A.T. Shih and C.M.
- Page 299 and 300:
REFERENCES [419] J.H. Spurk. Ström
- Page 301 and 302:
REFERENCES [441] J.S. Tsai and A.M.
- Page 303 and 304:
REFERENCES [462] S.-C. Wong, A.-C.