

Demographic Profile of Senior in Wayne County, Michigan
Demographic Profile of Senior in Wayne County, Michigan
Demographic Profile of Senior in Wayne County, Michigan

You also want an ePaper? Increase the reach of your titles
YUMPU automatically turns print PDFs into web optimized ePapers that Google loves.
A <strong>Demographic</strong> <strong>Pr<strong>of</strong>ile</strong> <strong>of</strong> <strong>Senior</strong>s <strong>in</strong> <strong>Wayne</strong> <strong>County</strong><br />
Implications for Fund<strong>in</strong>g and Service Delivery<br />
Key F<strong>in</strong>d<strong>in</strong>gs<br />
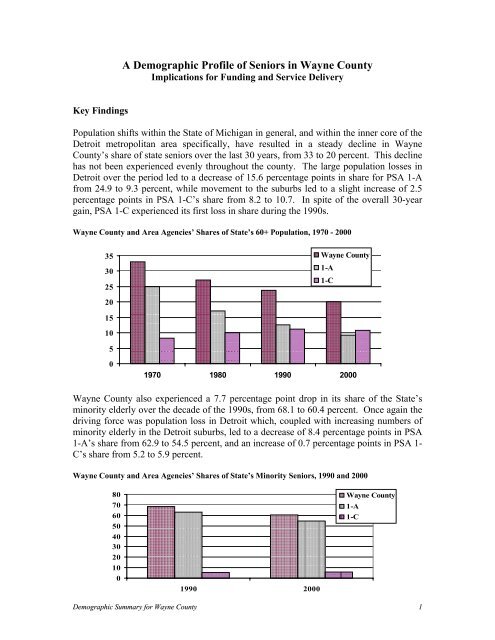
Population shifts with<strong>in</strong> the State <strong>of</strong> <strong>Michigan</strong> <strong>in</strong> general, and with<strong>in</strong> the <strong>in</strong>ner core <strong>of</strong> the<br />
Detroit metropolitan area specifically, have resulted <strong>in</strong> a steady decl<strong>in</strong>e <strong>in</strong> <strong>Wayne</strong><br />
<strong>County</strong>’s share <strong>of</strong> state seniors over the last 30 years, from 33 to 20 percent. This decl<strong>in</strong>e<br />
has not been experienced evenly throughout the county. The large population losses <strong>in</strong><br />
Detroit over the period led to a decrease <strong>of</strong> 15.6 percentage po<strong>in</strong>ts <strong>in</strong> share for PSA 1-A<br />
from 24.9 to 9.3 percent, while movement to the suburbs led to a slight <strong>in</strong>crease <strong>of</strong> 2.5<br />
percentage po<strong>in</strong>ts <strong>in</strong> PSA 1-C’s share from 8.2 to 10.7. In spite <strong>of</strong> the overall 30-year<br />
ga<strong>in</strong>, PSA 1-C experienced its first loss <strong>in</strong> share dur<strong>in</strong>g the 1990s.<br />
<strong>Wayne</strong> <strong>County</strong> and Area Agencies’ Shares <strong>of</strong> State’s 60+ Population, 1970 - 2000<br />
35<br />
30<br />
25<br />
<strong>Wayne</strong> <strong>County</strong><br />
1-A<br />
1-C<br />
20<br />
15<br />
10<br />
5<br />
0<br />
1970 1980 1990 2000<br />
<strong>Wayne</strong> <strong>County</strong> also experienced a 7.7 percentage po<strong>in</strong>t drop <strong>in</strong> its share <strong>of</strong> the State’s<br />
m<strong>in</strong>ority elderly over the decade <strong>of</strong> the 1990s, from 68.1 to 60.4 percent. Once aga<strong>in</strong> the<br />
driv<strong>in</strong>g force was population loss <strong>in</strong> Detroit which, coupled with <strong>in</strong>creas<strong>in</strong>g numbers <strong>of</strong><br />
m<strong>in</strong>ority elderly <strong>in</strong> the Detroit suburbs, led to a decrease <strong>of</strong> 8.4 percentage po<strong>in</strong>ts <strong>in</strong> PSA<br />
1-A’s share from 62.9 to 54.5 percent, and an <strong>in</strong>crease <strong>of</strong> 0.7 percentage po<strong>in</strong>ts <strong>in</strong> PSA 1-<br />
C’s share from 5.2 to 5.9 percent.<br />
<strong>Wayne</strong> <strong>County</strong> and Area Agencies’ Shares <strong>of</strong> State’s M<strong>in</strong>ority <strong>Senior</strong>s, 1990 and 2000<br />
80<br />
70<br />
60<br />
50<br />
40<br />
30<br />
20<br />
10<br />
0<br />
1990 2000<br />
<strong>Wayne</strong> <strong>County</strong><br />
1-A<br />
1-C<br />
<strong>Demographic</strong> Summary for <strong>Wayne</strong> <strong>County</strong> 1


