

Demographic Profile of Senior in Wayne County, Michigan
Demographic Profile of Senior in Wayne County, Michigan
Demographic Profile of Senior in Wayne County, Michigan

You also want an ePaper? Increase the reach of your titles
YUMPU automatically turns print PDFs into web optimized ePapers that Google loves.
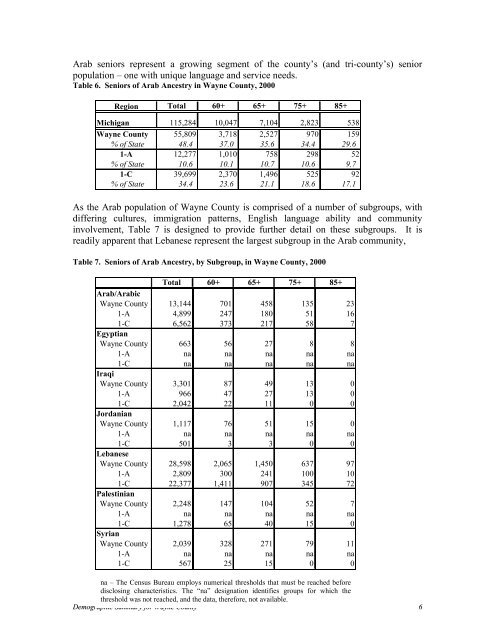
Arab seniors represent a grow<strong>in</strong>g segment <strong>of</strong> the county’s (and tri-county’s) senior<br />
population – one with unique language and service needs.<br />
Table 6. <strong>Senior</strong>s <strong>of</strong> Arab Ancestry <strong>in</strong> <strong>Wayne</strong> <strong>County</strong>, 2000<br />
Region Total 60+ 65+ 75+ 85+<br />
<strong>Michigan</strong> 115,284 10,047 7,104 2,823 538<br />
<strong>Wayne</strong> <strong>County</strong> 55,809 3,718 2,527 970 159<br />
% <strong>of</strong> State 48.4 37.0 35.6 34.4 29.6<br />
1-A 12,277 1,010 758 298 52<br />
% <strong>of</strong> State 10.6 10.1 10.7 10.6 9.7<br />
1-C 39,699 2,370 1,496 525 92<br />
% <strong>of</strong> State 34.4 23.6 21.1 18.6 17.1<br />
As the Arab population <strong>of</strong> <strong>Wayne</strong> <strong>County</strong> is comprised <strong>of</strong> a number <strong>of</strong> subgroups, with<br />
differ<strong>in</strong>g cultures, immigration patterns, English language ability and community<br />
<strong>in</strong>volvement, Table 7 is designed to provide further detail on these subgroups. It is<br />
readily apparent that Lebanese represent the largest subgroup <strong>in</strong> the Arab community,<br />
Table 7. <strong>Senior</strong>s <strong>of</strong> Arab Ancestry, by Subgroup, <strong>in</strong> <strong>Wayne</strong> <strong>County</strong>, 2000<br />
Total 60+ 65+ 75+ 85+<br />
Arab/Arabic<br />
<strong>Wayne</strong> <strong>County</strong> 13,144 701 458 135 23<br />
1-A 4,899 247 180 51 16<br />
1-C 6,562 373 217 58 7<br />
Egyptian<br />
<strong>Wayne</strong> <strong>County</strong> 663 56 27 8 8<br />
1-A na na na na na<br />
1-C na na na na na<br />
Iraqi<br />
<strong>Wayne</strong> <strong>County</strong> 3,301 87 49 13 0<br />
1-A 966 47 27 13 0<br />
1-C 2,042 22 11 0 0<br />
Jordanian<br />
<strong>Wayne</strong> <strong>County</strong> 1,117 76 51 15 0<br />
1-A na na na na na<br />
1-C 501 3 3 0 0<br />
Lebanese<br />
<strong>Wayne</strong> <strong>County</strong> 28,598 2,065 1,450 637 97<br />
1-A 2,809 300 241 100 10<br />
1-C 22,377 1,411 907 345 72<br />
Palest<strong>in</strong>ian<br />
<strong>Wayne</strong> <strong>County</strong> 2,248 147 104 52 7<br />
1-A na na na na na<br />
1-C 1,278 65 40 15 0<br />
Syrian<br />
<strong>Wayne</strong> <strong>County</strong> 2,039 328 271 79 11<br />
1-A na na na na na<br />
1-C 567 25 15 0 0<br />
na – The Census Bureau employs numerical thresholds that must be reached before<br />
disclos<strong>in</strong>g characteristics. The “na” designation identifies groups for which the<br />
threshold was not reached, and the data, therefore, not available.<br />
<strong>Demographic</strong> Summary for <strong>Wayne</strong> <strong>County</strong> 6


