

Demographic Profile of Senior in Wayne County, Michigan
Demographic Profile of Senior in Wayne County, Michigan
Demographic Profile of Senior in Wayne County, Michigan

Create successful ePaper yourself
Turn your PDF publications into a flip-book with our unique Google optimized e-Paper software.
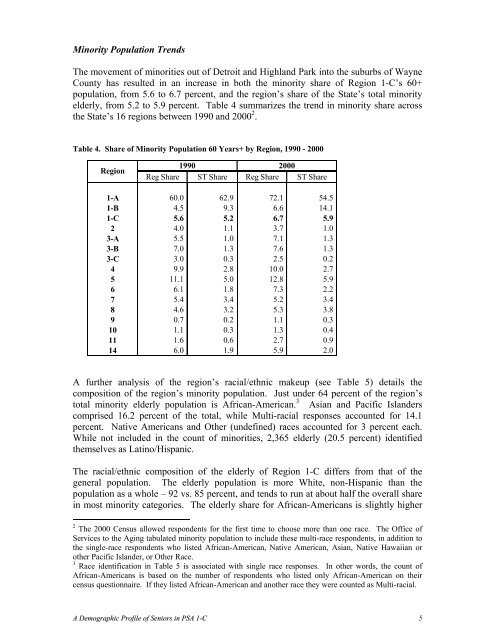
M<strong>in</strong>ority Population Trends<br />
The movement <strong>of</strong> m<strong>in</strong>orities out <strong>of</strong> Detroit and Highland Park <strong>in</strong>to the suburbs <strong>of</strong> <strong>Wayne</strong><br />
<strong>County</strong> has resulted <strong>in</strong> an <strong>in</strong>crease <strong>in</strong> both the m<strong>in</strong>ority share <strong>of</strong> Region 1-C’s 60+<br />
population, from 5.6 to 6.7 percent, and the region’s share <strong>of</strong> the State’s total m<strong>in</strong>ority<br />
elderly, from 5.2 to 5.9 percent. Table 4 summarizes the trend <strong>in</strong> m<strong>in</strong>ority share across<br />
the State’s 16 regions between 1990 and 2000 2 .<br />
Table 4. Share <strong>of</strong> M<strong>in</strong>ority Population 60 Years+ by Region, 1990 - 2000<br />
Region<br />
1990 2000<br />
Reg Share ST Share Reg Share ST Share<br />
1-A 60.0 62.9 72.1 54.5<br />
1-B 4.5 9.3 6.6 14.1<br />
1-C 5.6 5.2 6.7 5.9<br />
2 4.0 1.1 3.7 1.0<br />
3-A 5.5 1.0 7.1 1.3<br />
3-B 7.0 1.3 7.6 1.3<br />
3-C 3.0 0.3 2.5 0.2<br />
4 9.9 2.8 10.0 2.7<br />
5 11.1 5.0 12.8 5.9<br />
6 6.1 1.8 7.3 2.2<br />
7 5.4 3.4 5.2 3.4<br />
8 4.6 3.2 5.3 3.8<br />
9 0.7 0.2 1.1 0.3<br />
10 1.1 0.3 1.3 0.4<br />
11 1.6 0.6 2.7 0.9<br />
14 6.0 1.9 5.9 2.0<br />
A further analysis <strong>of</strong> the region’s racial/ethnic makeup (see Table 5) details the<br />
composition <strong>of</strong> the region’s m<strong>in</strong>ority population. Just under 64 percent <strong>of</strong> the region’s<br />
total m<strong>in</strong>ority elderly population is African-American. 3 Asian and Pacific Islanders<br />
comprised 16.2 percent <strong>of</strong> the total, while Multi-racial responses accounted for 14.1<br />
percent. Native Americans and Other (undef<strong>in</strong>ed) races accounted for 3 percent each.<br />
While not <strong>in</strong>cluded <strong>in</strong> the count <strong>of</strong> m<strong>in</strong>orities, 2,365 elderly (20.5 percent) identified<br />
themselves as Lat<strong>in</strong>o/Hispanic.<br />
The racial/ethnic composition <strong>of</strong> the elderly <strong>of</strong> Region 1-C differs from that <strong>of</strong> the<br />
general population. The elderly population is more White, non-Hispanic than the<br />
population as a whole – 92 vs. 85 percent, and tends to run at about half the overall share<br />
<strong>in</strong> most m<strong>in</strong>ority categories. The elderly share for African-Americans is slightly higher<br />
2 The 2000 Census allowed respondents for the first time to choose more than one race. The Office <strong>of</strong><br />
Services to the Ag<strong>in</strong>g tabulated m<strong>in</strong>ority population to <strong>in</strong>clude these multi-race respondents, <strong>in</strong> addition to<br />
the s<strong>in</strong>gle-race respondents who listed African-American, Native American, Asian, Native Hawaiian or<br />
other Pacific Islander, or Other Race.<br />
3 Race identification <strong>in</strong> Table 5 is associated with s<strong>in</strong>gle race responses. In other words, the count <strong>of</strong><br />
African-Americans is based on the number <strong>of</strong> respondents who listed only African-American on their<br />
census questionnaire. If they listed African-American and another race they were counted as Multi-racial.<br />
A <strong>Demographic</strong> <strong>Pr<strong>of</strong>ile</strong> <strong>of</strong> <strong>Senior</strong>s <strong>in</strong> PSA 1-C 5


