

Demographic Profile of Senior in Wayne County, Michigan
Demographic Profile of Senior in Wayne County, Michigan
Demographic Profile of Senior in Wayne County, Michigan

You also want an ePaper? Increase the reach of your titles
YUMPU automatically turns print PDFs into web optimized ePapers that Google loves.
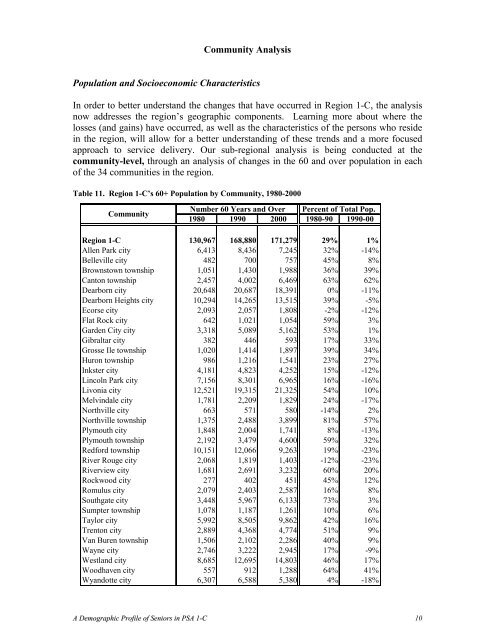
Community Analysis<br />
Population and Socioeconomic Characteristics<br />
In order to better understand the changes that have occurred <strong>in</strong> Region 1-C, the analysis<br />
now addresses the region’s geographic components. Learn<strong>in</strong>g more about where the<br />
losses (and ga<strong>in</strong>s) have occurred, as well as the characteristics <strong>of</strong> the persons who reside<br />
<strong>in</strong> the region, will allow for a better understand<strong>in</strong>g <strong>of</strong> these trends and a more focused<br />
approach to service delivery. Our sub-regional analysis is be<strong>in</strong>g conducted at the<br />
community-level, through an analysis <strong>of</strong> changes <strong>in</strong> the 60 and over population <strong>in</strong> each<br />
<strong>of</strong> the 34 communities <strong>in</strong> the region.<br />
Table 11. Region 1-C’s 60+ Population by Community, 1980-2000<br />
Community<br />
Number 60 Years and Over Percent <strong>of</strong> Total Pop.<br />
1980 1990 2000 1980-90 1990-00<br />
Region 1-C 130,967 168,880 171,279 29% 1%<br />
Allen Park city 6,413 8,436 7,245 32% -14%<br />
Belleville city 482 700 757 45% 8%<br />
Brownstown township 1,051 1,430 1,988 36% 39%<br />
Canton township 2,457 4,002 6,469 63% 62%<br />
Dearborn city 20,648 20,687 18,391 0% -11%<br />
Dearborn Heights city 10,294 14,265 13,515 39% -5%<br />
Ecorse city 2,093 2,057 1,808 -2% -12%<br />
Flat Rock city 642 1,021 1,054 59% 3%<br />
Garden City city 3,318 5,089 5,162 53% 1%<br />
Gibraltar city 382 446 593 17% 33%<br />
Grosse Ile township 1,020 1,414 1,897 39% 34%<br />
Huron township 986 1,216 1,541 23% 27%<br />
Inkster city 4,181 4,823 4,252 15% -12%<br />
L<strong>in</strong>coln Park city 7,156 8,301 6,965 16% -16%<br />
Livonia city 12,521 19,315 21,325 54% 10%<br />
Melv<strong>in</strong>dale city 1,781 2,209 1,829 24% -17%<br />
Northville city 663 571 580 -14% 2%<br />
Northville township 1,375 2,488 3,899 81% 57%<br />
Plymouth city 1,848 2,004 1,741 8% -13%<br />
Plymouth township 2,192 3,479 4,600 59% 32%<br />
Redford township 10,151 12,066 9,263 19% -23%<br />
River Rouge city 2,068 1,819 1,403 -12% -23%<br />
Riverview city 1,681 2,691 3,232 60% 20%<br />
Rockwood city 277 402 451 45% 12%<br />
Romulus city 2,079 2,403 2,587 16% 8%<br />
Southgate city 3,448 5,967 6,133 73% 3%<br />
Sumpter township 1,078 1,187 1,261 10% 6%<br />
Taylor city 5,992 8,505 9,862 42% 16%<br />
Trenton city 2,889 4,368 4,774 51% 9%<br />
Van Buren township 1,506 2,102 2,286 40% 9%<br />
<strong>Wayne</strong> city 2,746 3,222 2,945 17% -9%<br />
Westland city 8,685 12,695 14,803 46% 17%<br />
Woodhaven city 557 912 1,288 64% 41%<br />
Wyandotte city 6,307 6,588 5,380 4% -18%<br />
A <strong>Demographic</strong> <strong>Pr<strong>of</strong>ile</strong> <strong>of</strong> <strong>Senior</strong>s <strong>in</strong> PSA 1-C 10


