

Demographic Profile of Senior in Wayne County, Michigan
Demographic Profile of Senior in Wayne County, Michigan
Demographic Profile of Senior in Wayne County, Michigan

You also want an ePaper? Increase the reach of your titles
YUMPU automatically turns print PDFs into web optimized ePapers that Google loves.
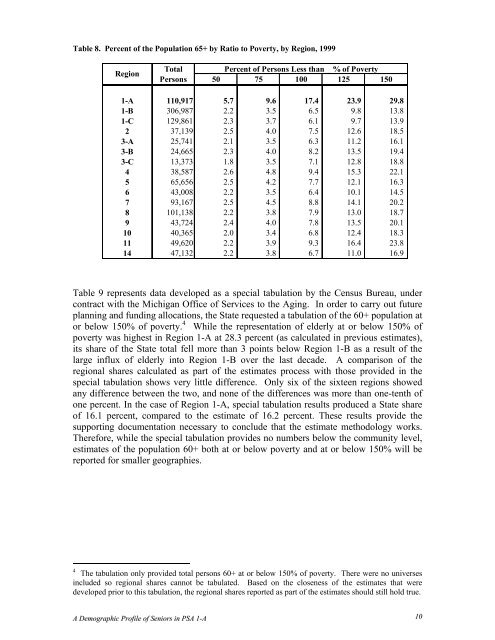
Table 8. Percent <strong>of</strong> the Population 65+ by Ratio to Poverty, by Region, 1999<br />
Region<br />
Total<br />
Persons<br />
Percent <strong>of</strong> Persons Less than _ % <strong>of</strong> Poverty<br />
50 75 100 125 150<br />
1-A 110,917 5.7 9.6 17.4 23.9 29.8<br />
1-B 306,987 2.2 3.5 6.5 9.8 13.8<br />
1-C 129,861 2.3 3.7 6.1 9.7 13.9<br />
2 37,139 2.5 4.0 7.5 12.6 18.5<br />
3-A 25,741 2.1 3.5 6.3 11.2 16.1<br />
3-B 24,665 2.3 4.0 8.2 13.5 19.4<br />
3-C 13,373 1.8 3.5 7.1 12.8 18.8<br />
4 38,587 2.6 4.8 9.4 15.3 22.1<br />
5 65,656 2.5 4.2 7.7 12.1 16.3<br />
6 43,008 2.2 3.5 6.4 10.1 14.5<br />
7 93,167 2.5 4.5 8.8 14.1 20.2<br />
8 101,138 2.2 3.8 7.9 13.0 18.7<br />
9 43,724 2.4 4.0 7.8 13.5 20.1<br />
10 40,365 2.0 3.4 6.8 12.4 18.3<br />
11 49,620 2.2 3.9 9.3 16.4 23.8<br />
14 47,132 2.2 3.8 6.7 11.0 16.9<br />
Table 9 represents data developed as a special tabulation by the Census Bureau, under<br />
contract with the <strong>Michigan</strong> Office <strong>of</strong> Services to the Ag<strong>in</strong>g. In order to carry out future<br />
plann<strong>in</strong>g and fund<strong>in</strong>g allocations, the State requested a tabulation <strong>of</strong> the 60+ population at<br />
or below 150% <strong>of</strong> poverty. 4 While the representation <strong>of</strong> elderly at or below 150% <strong>of</strong><br />
poverty was highest <strong>in</strong> Region 1-A at 28.3 percent (as calculated <strong>in</strong> previous estimates),<br />
its share <strong>of</strong> the State total fell more than 3 po<strong>in</strong>ts below Region 1-B as a result <strong>of</strong> the<br />
large <strong>in</strong>flux <strong>of</strong> elderly <strong>in</strong>to Region 1-B over the last decade. A comparison <strong>of</strong> the<br />
regional shares calculated as part <strong>of</strong> the estimates process with those provided <strong>in</strong> the<br />
special tabulation shows very little difference. Only six <strong>of</strong> the sixteen regions showed<br />
any difference between the two, and none <strong>of</strong> the differences was more than one-tenth <strong>of</strong><br />
one percent. In the case <strong>of</strong> Region 1-A, special tabulation results produced a State share<br />
<strong>of</strong> 16.1 percent, compared to the estimate <strong>of</strong> 16.2 percent. These results provide the<br />
support<strong>in</strong>g documentation necessary to conclude that the estimate methodology works.<br />
Therefore, while the special tabulation provides no numbers below the community level,<br />
estimates <strong>of</strong> the population 60+ both at or below poverty and at or below 150% will be<br />
reported for smaller geographies.<br />
4 The tabulation only provided total persons 60+ at or below 150% <strong>of</strong> poverty. There were no universes<br />
<strong>in</strong>cluded so regional shares cannot be tabulated. Based on the closeness <strong>of</strong> the estimates that were<br />
developed prior to this tabulation, the regional shares reported as part <strong>of</strong> the estimates should still hold true.<br />
A <strong>Demographic</strong> <strong>Pr<strong>of</strong>ile</strong> <strong>of</strong> <strong>Senior</strong>s <strong>in</strong> PSA 1-A 10


