

Demographic Profile of Senior in Wayne County, Michigan
Demographic Profile of Senior in Wayne County, Michigan
Demographic Profile of Senior in Wayne County, Michigan

You also want an ePaper? Increase the reach of your titles
YUMPU automatically turns print PDFs into web optimized ePapers that Google loves.
One component <strong>of</strong> this tabulation that is discussed <strong>in</strong> the next section – race - deserves<br />
additional discussion <strong>in</strong> light <strong>of</strong> the PUMS analysis. While the vast majority <strong>of</strong> m<strong>in</strong>ority<br />
seniors (primarily Black) who moved rema<strong>in</strong>ed <strong>in</strong> <strong>Wayne</strong> <strong>County</strong> (primarily Detroit), a<br />
significant number did choose Oakland <strong>County</strong> as their home. Thirty percent <strong>of</strong> seniors<br />
who moved to Oakland <strong>County</strong> were non-White. This contrasts with the 6 percent non-<br />
White component that moved to Macomb <strong>County</strong>.<br />
Migration Trends <strong>of</strong> <strong>Wayne</strong> and Monroe <strong>County</strong> <strong>Senior</strong>s Between 1995 and 2000<br />
Total Movers White Black Other Where Did They Go?<br />
45,107 27,244 16,413 1,450 Moved With<strong>in</strong> Area<br />
18,090 3,151 14,194 745 Detroit<br />
27,017 24,093 2,219 705 <strong>Wayne</strong> <strong>County</strong> rema<strong>in</strong>der/Monroe <strong>County</strong><br />
22,941 19,572 2,994 375 Moved Out <strong>of</strong> Area<br />
4,764 4,483 229 52 Macomb <strong>County</strong><br />
5,491 3,850 1,532 109 Oakland <strong>County</strong><br />
5,971 5,409 522 40 Rema<strong>in</strong>der <strong>of</strong> Southeast <strong>Michigan</strong><br />
349 309 40 0 Fl<strong>in</strong>t/Genesee <strong>County</strong><br />
6,366 5,521 671 174 State Rema<strong>in</strong>der<br />
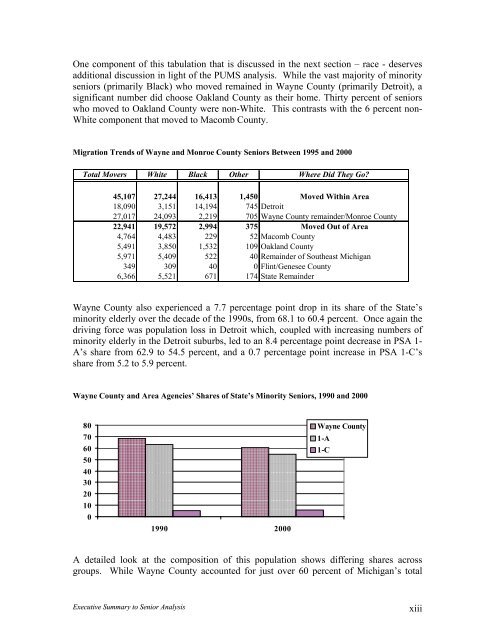
<strong>Wayne</strong> <strong>County</strong> also experienced a 7.7 percentage po<strong>in</strong>t drop <strong>in</strong> its share <strong>of</strong> the State’s<br />
m<strong>in</strong>ority elderly over the decade <strong>of</strong> the 1990s, from 68.1 to 60.4 percent. Once aga<strong>in</strong> the<br />
driv<strong>in</strong>g force was population loss <strong>in</strong> Detroit which, coupled with <strong>in</strong>creas<strong>in</strong>g numbers <strong>of</strong><br />
m<strong>in</strong>ority elderly <strong>in</strong> the Detroit suburbs, led to an 8.4 percentage po<strong>in</strong>t decrease <strong>in</strong> PSA 1-<br />
A’s share from 62.9 to 54.5 percent, and a 0.7 percentage po<strong>in</strong>t <strong>in</strong>crease <strong>in</strong> PSA 1-C’s<br />
share from 5.2 to 5.9 percent.<br />
<strong>Wayne</strong> <strong>County</strong> and Area Agencies’ Shares <strong>of</strong> State’s M<strong>in</strong>ority <strong>Senior</strong>s, 1990 and 2000<br />
80<br />
70<br />
60<br />
50<br />
40<br />
30<br />
20<br />
10<br />
0<br />
1990 2000<br />
<strong>Wayne</strong> <strong>County</strong><br />
1-A<br />
1-C<br />
A detailed look at the composition <strong>of</strong> this population shows differ<strong>in</strong>g shares across<br />
groups. While <strong>Wayne</strong> <strong>County</strong> accounted for just over 60 percent <strong>of</strong> <strong>Michigan</strong>’s total<br />
Executive Summary to <strong>Senior</strong> Analysis<br />
xiii


