

Demographic Profile of Senior in Wayne County, Michigan
Demographic Profile of Senior in Wayne County, Michigan
Demographic Profile of Senior in Wayne County, Michigan

Create successful ePaper yourself
Turn your PDF publications into a flip-book with our unique Google optimized e-Paper software.
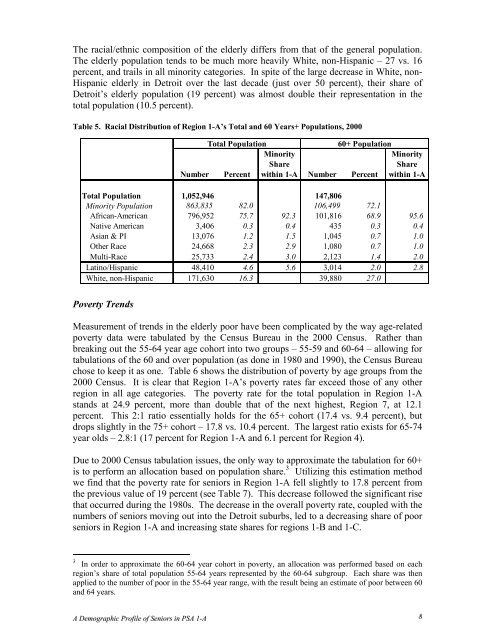
The racial/ethnic composition <strong>of</strong> the elderly differs from that <strong>of</strong> the general population.<br />
The elderly population tends to be much more heavily White, non-Hispanic – 27 vs. 16<br />
percent, and trails <strong>in</strong> all m<strong>in</strong>ority categories. In spite <strong>of</strong> the large decrease <strong>in</strong> White, non-<br />
Hispanic elderly <strong>in</strong> Detroit over the last decade (just over 50 percent), their share <strong>of</strong><br />
Detroit’s elderly population (19 percent) was almost double their representation <strong>in</strong> the<br />
total population (10.5 percent).<br />
Table 5. Racial Distribution <strong>of</strong> Region 1-A’s Total and 60 Years+ Populations, 2000<br />
Total Population<br />
60+ Population<br />
Number Percent<br />
M<strong>in</strong>ority<br />
Share<br />
with<strong>in</strong> 1-A Number Percent<br />
M<strong>in</strong>ority<br />
Share<br />
with<strong>in</strong> 1-A<br />
Total Population 1,052,946 147,806<br />
M<strong>in</strong>ority Population 863,835 82.0 106,499 72.1<br />
African-American 796,952 75.7 92.3 101,816 68.9 95.6<br />
Native American 3,406 0.3 0.4 435 0.3 0.4<br />
Asian & PI 13,076 1.2 1.5 1,045 0.7 1.0<br />
Other Race 24,668 2.3 2.9 1,080 0.7 1.0<br />
Multi-Race 25,733 2.4 3.0 2,123 1.4 2.0<br />
Lat<strong>in</strong>o/Hispanic 48,410 4.6 5.6 3,014 2.0 2.8<br />
White, non-Hispanic 171,630 16.3 39,880 27.0<br />
Poverty Trends<br />
Measurement <strong>of</strong> trends <strong>in</strong> the elderly poor have been complicated by the way age-related<br />
poverty data were tabulated by the Census Bureau <strong>in</strong> the 2000 Census. Rather than<br />
break<strong>in</strong>g out the 55-64 year age cohort <strong>in</strong>to two groups – 55-59 and 60-64 – allow<strong>in</strong>g for<br />
tabulations <strong>of</strong> the 60 and over population (as done <strong>in</strong> 1980 and 1990), the Census Bureau<br />
chose to keep it as one. Table 6 shows the distribution <strong>of</strong> poverty by age groups from the<br />
2000 Census. It is clear that Region 1-A’s poverty rates far exceed those <strong>of</strong> any other<br />
region <strong>in</strong> all age categories. The poverty rate for the total population <strong>in</strong> Region 1-A<br />
stands at 24.9 percent, more than double that <strong>of</strong> the next highest, Region 7, at 12.1<br />
percent. This 2:1 ratio essentially holds for the 65+ cohort (17.4 vs. 9.4 percent), but<br />
drops slightly <strong>in</strong> the 75+ cohort – 17.8 vs. 10.4 percent. The largest ratio exists for 65-74<br />
year olds – 2.8:1 (17 percent for Region 1-A and 6.1 percent for Region 4).<br />
Due to 2000 Census tabulation issues, the only way to approximate the tabulation for 60+<br />
is to perform an allocation based on population share. 3 Utiliz<strong>in</strong>g this estimation method<br />
we f<strong>in</strong>d that the poverty rate for seniors <strong>in</strong> Region 1-A fell slightly to 17.8 percent from<br />
the previous value <strong>of</strong> 19 percent (see Table 7). This decrease followed the significant rise<br />
that occurred dur<strong>in</strong>g the 1980s. The decrease <strong>in</strong> the overall poverty rate, coupled with the<br />
numbers <strong>of</strong> seniors mov<strong>in</strong>g out <strong>in</strong>to the Detroit suburbs, led to a decreas<strong>in</strong>g share <strong>of</strong> poor<br />
seniors <strong>in</strong> Region 1-A and <strong>in</strong>creas<strong>in</strong>g state shares for regions 1-B and 1-C.<br />
3<br />
In order to approximate the 60-64 year cohort <strong>in</strong> poverty, an allocation was performed based on each<br />
region’s share <strong>of</strong> total population 55-64 years represented by the 60-64 subgroup. Each share was then<br />
applied to the number <strong>of</strong> poor <strong>in</strong> the 55-64 year range, with the result be<strong>in</strong>g an estimate <strong>of</strong> poor between 60<br />
and 64 years.<br />
A <strong>Demographic</strong> <strong>Pr<strong>of</strong>ile</strong> <strong>of</strong> <strong>Senior</strong>s <strong>in</strong> PSA 1-A 8


