

Demographic Profile of Senior in Wayne County, Michigan
Demographic Profile of Senior in Wayne County, Michigan
Demographic Profile of Senior in Wayne County, Michigan

Create successful ePaper yourself
Turn your PDF publications into a flip-book with our unique Google optimized e-Paper software.
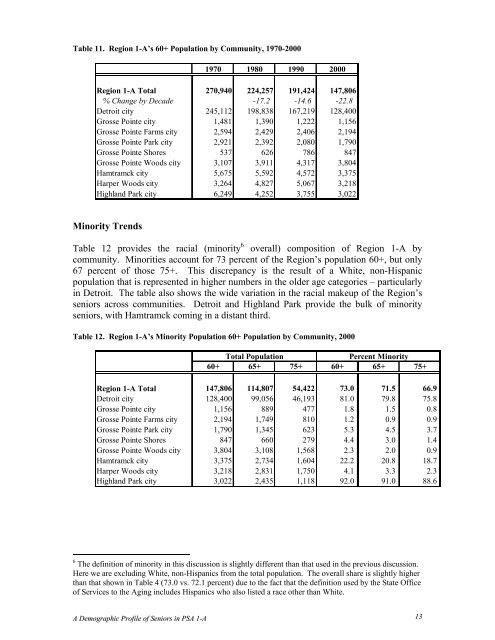
Table 11. Region 1-A’s 60+ Population by Community, 1970-2000<br />
1970 1980 1990 2000<br />
Region 1-A Total 270,940 224,257 191,424 147,806<br />
% Change by Decade -17.2 -14.6 -22.8<br />
Detroit city 245,112 198,838 167,219 128,400<br />
Grosse Po<strong>in</strong>te city 1,481 1,390 1,222 1,156<br />
Grosse Po<strong>in</strong>te Farms city 2,594 2,429 2,406 2,194<br />
Grosse Po<strong>in</strong>te Park city 2,921 2,392 2,080 1,790<br />
Grosse Po<strong>in</strong>te Shores 537 626 786 847<br />
Grosse Po<strong>in</strong>te Woods city 3,107 3,911 4,317 3,804<br />
Hamtramck city 5,675 5,592 4,572 3,375<br />
Harper Woods city 3,264 4,827 5,067 3,218<br />
Highland Park city 6,249 4,252 3,755 3,022<br />
M<strong>in</strong>ority Trends<br />
Table 12 provides the racial (m<strong>in</strong>ority 6 overall) composition <strong>of</strong> Region 1-A by<br />
community. M<strong>in</strong>orities account for 73 percent <strong>of</strong> the Region’s population 60+, but only<br />
67 percent <strong>of</strong> those 75+. This discrepancy is the result <strong>of</strong> a White, non-Hispanic<br />
population that is represented <strong>in</strong> higher numbers <strong>in</strong> the older age categories – particularly<br />
<strong>in</strong> Detroit. The table also shows the wide variation <strong>in</strong> the racial makeup <strong>of</strong> the Region’s<br />
seniors across communities. Detroit and Highland Park provide the bulk <strong>of</strong> m<strong>in</strong>ority<br />
seniors, with Hamtramck com<strong>in</strong>g <strong>in</strong> a distant third.<br />
Table 12. Region 1-A’s M<strong>in</strong>ority Population 60+ Population by Community, 2000<br />
Total Population<br />
Percent M<strong>in</strong>ority<br />
60+ 65+ 75+ 60+ 65+ 75+<br />
Region 1-A Total 147,806 114,807 54,422 73.0 71.5 66.9<br />
Detroit city 128,400 99,056 46,193 81.0 79.8 75.8<br />
Grosse Po<strong>in</strong>te city 1,156 889 477 1.8 1.5 0.8<br />
Grosse Po<strong>in</strong>te Farms city 2,194 1,749 810 1.2 0.9 0.9<br />
Grosse Po<strong>in</strong>te Park city 1,790 1,345 623 5.3 4.5 3.7<br />
Grosse Po<strong>in</strong>te Shores 847 660 279 4.4 3.0 1.4<br />
Grosse Po<strong>in</strong>te Woods city 3,804 3,108 1,568 2.3 2.0 0.9<br />
Hamtramck city 3,375 2,734 1,604 22.2 20.8 18.7<br />
Harper Woods city 3,218 2,831 1,750 4.1 3.3 2.3<br />
Highland Park city 3,022 2,435 1,118 92.0 91.0 88.6<br />
6 The def<strong>in</strong>ition <strong>of</strong> m<strong>in</strong>ority <strong>in</strong> this discussion is slightly different than that used <strong>in</strong> the previous discussion.<br />
Here we are exclud<strong>in</strong>g White, non-Hispanics from the total population. The overall share is slightly higher<br />
than that shown <strong>in</strong> Table 4 (73.0 vs. 72.1 percent) due to the fact that the def<strong>in</strong>ition used by the State Office<br />
<strong>of</strong> Services to the Ag<strong>in</strong>g <strong>in</strong>cludes Hispanics who also listed a race other than White.<br />
A <strong>Demographic</strong> <strong>Pr<strong>of</strong>ile</strong> <strong>of</strong> <strong>Senior</strong>s <strong>in</strong> PSA 1-A 13


