

Demographic Profile of Senior in Wayne County, Michigan
Demographic Profile of Senior in Wayne County, Michigan
Demographic Profile of Senior in Wayne County, Michigan

You also want an ePaper? Increase the reach of your titles
YUMPU automatically turns print PDFs into web optimized ePapers that Google loves.
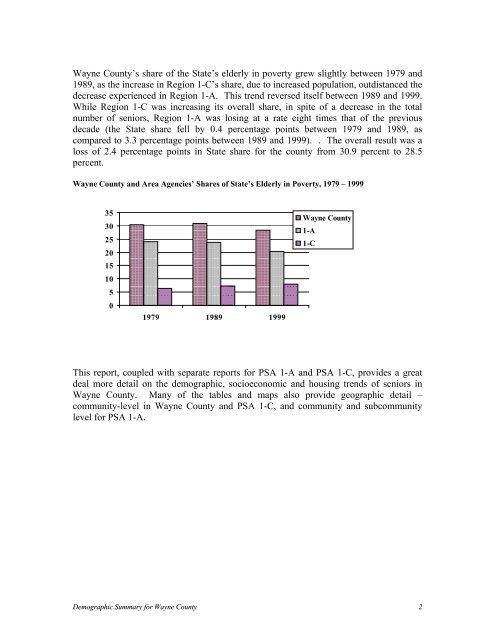
<strong>Wayne</strong> <strong>County</strong>’s share <strong>of</strong> the State’s elderly <strong>in</strong> poverty grew slightly between 1979 and<br />
1989, as the <strong>in</strong>crease <strong>in</strong> Region 1-C’s share, due to <strong>in</strong>creased population, outdistanced the<br />
decrease experienced <strong>in</strong> Region 1-A. This trend reversed itself between 1989 and 1999.<br />
While Region 1-C was <strong>in</strong>creas<strong>in</strong>g its overall share, <strong>in</strong> spite <strong>of</strong> a decrease <strong>in</strong> the total<br />
number <strong>of</strong> seniors, Region 1-A was los<strong>in</strong>g at a rate eight times that <strong>of</strong> the previous<br />
decade (the State share fell by 0.4 percentage po<strong>in</strong>ts between 1979 and 1989, as<br />
compared to 3.3 percentage po<strong>in</strong>ts between 1989 and 1999). . The overall result was a<br />
loss <strong>of</strong> 2.4 percentage po<strong>in</strong>ts <strong>in</strong> State share for the county from 30.9 percent to 28.5<br />
percent.<br />
<strong>Wayne</strong> <strong>County</strong> and Area Agencies’ Shares <strong>of</strong> State’s Elderly <strong>in</strong> Poverty, 1979 – 1999<br />
35<br />
30<br />
25<br />
20<br />
15<br />
10<br />
5<br />
0<br />
1979 1989 1999<br />
<strong>Wayne</strong> <strong>County</strong><br />
1-A<br />
1-C<br />
This report, coupled with separate reports for PSA 1-A and PSA 1-C, provides a great<br />
deal more detail on the demographic, socioeconomic and hous<strong>in</strong>g trends <strong>of</strong> seniors <strong>in</strong><br />
<strong>Wayne</strong> <strong>County</strong>. Many <strong>of</strong> the tables and maps also provide geographic detail –<br />
community-level <strong>in</strong> <strong>Wayne</strong> <strong>County</strong> and PSA 1-C, and community and subcommunity<br />
level for PSA 1-A.<br />
<strong>Demographic</strong> Summary for <strong>Wayne</strong> <strong>County</strong> 2


