

Demographic Profile of Senior in Wayne County, Michigan
Demographic Profile of Senior in Wayne County, Michigan
Demographic Profile of Senior in Wayne County, Michigan

You also want an ePaper? Increase the reach of your titles
YUMPU automatically turns print PDFs into web optimized ePapers that Google loves.
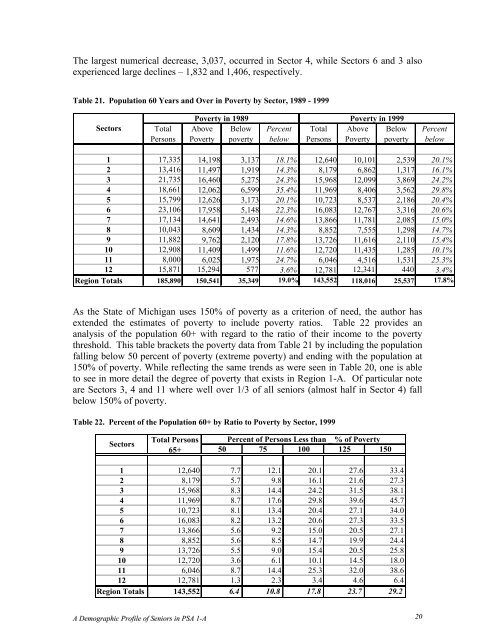
The largest numerical decrease, 3,037, occurred <strong>in</strong> Sector 4, while Sectors 6 and 3 also<br />
experienced large decl<strong>in</strong>es – 1,832 and 1,406, respectively.<br />
Table 21. Population 60 Years and Over <strong>in</strong> Poverty by Sector, 1989 - 1999<br />
Sectors<br />
Total<br />
Persons<br />
Poverty <strong>in</strong> 1989 Poverty <strong>in</strong> 1999<br />
Above Below Percent Total Above Below<br />
Poverty poverty below Persons Poverty poverty<br />
Percent<br />
below<br />
1 17,335 14,198 3,137 18.1% 12,640 10,101 2,539 20.1%<br />
2 13,416 11,497 1,919 14.3% 8,179 6,862 1,317 16.1%<br />
3 21,735 16,460 5,275 24.3% 15,968 12,099 3,869 24.2%<br />
4 18,661 12,062 6,599 35.4% 11,969 8,406 3,562 29.8%<br />
5 15,799 12,626 3,173 20.1% 10,723 8,537 2,186 20.4%<br />
6 23,106 17,958 5,148 22.3% 16,083 12,767 3,316 20.6%<br />
7 17,134 14,641 2,493 14.6% 13,866 11,781 2,085 15.0%<br />
8 10,043 8,609 1,434 14.3% 8,852 7,555 1,298 14.7%<br />
9 11,882 9,762 2,120 17.8% 13,726 11,616 2,110 15.4%<br />
10 12,908 11,409 1,499 11.6% 12,720 11,435 1,285 10.1%<br />
11 8,000 6,025 1,975 24.7% 6,046 4,516 1,531 25.3%<br />
12 15,871 15,294 577 3.6% 12,781 12,341 440 3.4%<br />
Region Totals 185,890 150,541 35,349 19.0% 143,552 118,016 25,537 17.8%<br />
As the State <strong>of</strong> <strong>Michigan</strong> uses 150% <strong>of</strong> poverty as a criterion <strong>of</strong> need, the author has<br />
extended the estimates <strong>of</strong> poverty to <strong>in</strong>clude poverty ratios. Table 22 provides an<br />
analysis <strong>of</strong> the population 60+ with regard to the ratio <strong>of</strong> their <strong>in</strong>come to the poverty<br />
threshold. This table brackets the poverty data from Table 21 by <strong>in</strong>clud<strong>in</strong>g the population<br />
fall<strong>in</strong>g below 50 percent <strong>of</strong> poverty (extreme poverty) and end<strong>in</strong>g with the population at<br />
150% <strong>of</strong> poverty. While reflect<strong>in</strong>g the same trends as were seen <strong>in</strong> Table 20, one is able<br />
to see <strong>in</strong> more detail the degree <strong>of</strong> poverty that exists <strong>in</strong> Region 1-A. Of particular note<br />
are Sectors 3, 4 and 11 where well over 1/3 <strong>of</strong> all seniors (almost half <strong>in</strong> Sector 4) fall<br />
below 150% <strong>of</strong> poverty.<br />
Table 22. Percent <strong>of</strong> the Population 60+ by Ratio to Poverty by Sector, 1999<br />
Sectors<br />
Total Persons<br />
65+<br />
Percent <strong>of</strong> Persons Less than _ % <strong>of</strong> Poverty<br />
50 75 100 125 150<br />
1 12,640 7.7 12.1 20.1 27.6 33.4<br />
2 8,179 5.7 9.8 16.1 21.6 27.3<br />
3 15,968 8.3 14.4 24.2 31.5 38.1<br />
4 11,969 8.7 17.6 29.8 39.6 45.7<br />
5 10,723 8.1 13.4 20.4 27.1 34.0<br />
6 16,083 8.2 13.2 20.6 27.3 33.5<br />
7 13,866 5.6 9.2 15.0 20.5 27.1<br />
8 8,852 5.6 8.5 14.7 19.9 24.4<br />
9 13,726 5.5 9.0 15.4 20.5 25.8<br />
10 12,720 3.6 6.1 10.1 14.5 18.0<br />
11 6,046 8.7 14.4 25.3 32.0 38.6<br />
12 12,781 1.3 2.3 3.4 4.6 6.4<br />
Region Totals 143,552 6.4 10.8 17.8 23.7 29.2<br />
A <strong>Demographic</strong> <strong>Pr<strong>of</strong>ile</strong> <strong>of</strong> <strong>Senior</strong>s <strong>in</strong> PSA 1-A 20


