

Demographic Profile of Senior in Wayne County, Michigan
Demographic Profile of Senior in Wayne County, Michigan
Demographic Profile of Senior in Wayne County, Michigan

You also want an ePaper? Increase the reach of your titles
YUMPU automatically turns print PDFs into web optimized ePapers that Google loves.
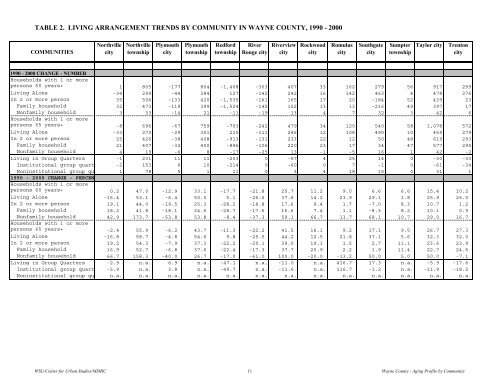
TABLE 2. LIVING ARRANGEMENT TRENDS BY COMMUNITY IN WAYNE COUNTY, 1990 - 2000<br />
COMMUNITIES<br />
Northville<br />
city<br />
Northville<br />
township<br />
Plymouth<br />
city<br />
Plymouth<br />
township<br />
Redford<br />
township<br />
River<br />
Rouge city<br />
Riverview<br />
city<br />
Rockwood<br />
city<br />
Romulus<br />
city<br />
Southgate<br />
city<br />
Sumpter<br />
township<br />
Taylor city<br />
Trenton<br />
city<br />
1990 - 2000 CHANGE - NUMBER<br />
Households with 1 or more<br />
persons 60 years+<br />
Liv<strong>in</strong>g Alone<br />
In 2 or more person<br />
Family household<br />
Nonfamily household<br />
Households with 1 or more<br />
persons 65 years+<br />
Liv<strong>in</strong>g Alone<br />
In 2 or more person<br />
Family household<br />
Nonfamily household<br />
Liv<strong>in</strong>g <strong>in</strong> Group Quarters<br />
Institutional group quart<br />
Non<strong>in</strong>stitutional group qu<br />
1990 - 2000 CHANGE - PERCENT<br />
Households with 1 or more<br />
persons 60 years+<br />
Liv<strong>in</strong>g Alone<br />
In 2 or more person<br />
Family household<br />
Nonfamily household<br />
Households with 1 or more<br />
persons 65 years+<br />
Liv<strong>in</strong>g Alone<br />
In 2 or more person<br />
Family household<br />
Nonfamily household<br />
Liv<strong>in</strong>g <strong>in</strong> Group Quarters<br />
Institutional group quart<br />
Non<strong>in</strong>stitutional group qu<br />
1 805 -177 804 -1,408 -303 407 33 162 279 56 917 299<br />
-34 299 -44 384 127 -142 242 16 142 463 4 478 276<br />
35 506 -133 420 -1,535 -161 165 17 20 -184 52 439 23<br />
32 473 -119 399 -1,524 -142 152 13 13 -216 49 397 17<br />
3 33 -14 21 -11 -19 13 4 7 32 3 42 6<br />
-8 696 -67 759 -703 -242 479 34 120 540 58 1,078 572<br />
-33 270 -29 351 210 -111 246 12 108 490 10 459 279<br />
25 426 -38 408 -913 -131 233 22 12 50 48 619 293<br />
21 407 -32 400 -896 -106 220 23 17 34 47 577 295<br />
4 19 -6 8 -17 -25 13 -1 -5 16 1 42 -2<br />
-1 231 11 11 -203 0 -57 4 25 14 0 -30 -33<br />
-2 153 6 10 -214 0 -60 0 7 -1 0 -61 -34<br />
1 78 5 1 11 0 3 4 18 15 0 31 1<br />
0.2 47.0 -12.9 33.1 -17.7 -21.8 25.7 11.2 9.0 6.6 6.6 15.4 10.2<br />
-15.4 53.1 -6.4 50.0 5.1 -26.6 37.6 14.2 23.9 29.1 1.8 25.9 26.5<br />
19.1 44.0 -19.5 25.3 -28.2 -18.8 17.6 9.4 1.7 -7.0 8.3 10.7 1.2<br />
18.2 41.8 -18.1 24.6 -28.7 -17.6 16.6 7.4 1.1 -8.3 8.2 10.1 0.9<br />
42.9 173.7 -53.8 53.8 -8.4 -37.3 59.1 66.7 13.7 68.1 10.7 29.0 16.7<br />
-2.4 55.9 -6.2 43.7 -11.3 -22.2 41.5 16.1 9.2 17.1 9.5 26.7 27.3<br />
-16.8 58.7 -4.8 54.6 9.8 -25.5 44.2 12.5 21.8 37.1 5.6 32.3 32.0<br />
19.2 54.3 -7.9 37.3 -22.2 -20.1 39.0 19.1 1.5 2.7 11.1 23.6 23.9<br />
16.9 52.7 -6.8 37.6 -22.4 -17.3 37.7 20.9 2.2 1.9 11.4 22.7 24.6<br />
66.7 158.3 -40.0 26.7 -17.0 -61.0 100.0 -20.0 -13.2 50.0 5.0 50.0 -7.1<br />
-2.9 n.a. 6.9 n.a. -47.1 n.a. -11.0 n.a. 416.7 17.3 n.a. -5.9 -17.6<br />
-5.9 n.a. 3.8 n.a. -49.7 n.a. -11.6 n.a. 116.7 -1.2 n.a. -11.9 -18.2<br />
n.a. n.a. n.a. n.a. n.a. n.a. n.a. n.a. n.a. n.a. n.a. n.a. n.a.<br />
WSU/Center for Urban Studies/MIMIC 11 <strong>Wayne</strong> <strong>County</strong> - Ag<strong>in</strong>g <strong>Pr<strong>of</strong>ile</strong> by Community


