

Demographic Profile of Senior in Wayne County, Michigan
Demographic Profile of Senior in Wayne County, Michigan
Demographic Profile of Senior in Wayne County, Michigan

Create successful ePaper yourself
Turn your PDF publications into a flip-book with our unique Google optimized e-Paper software.
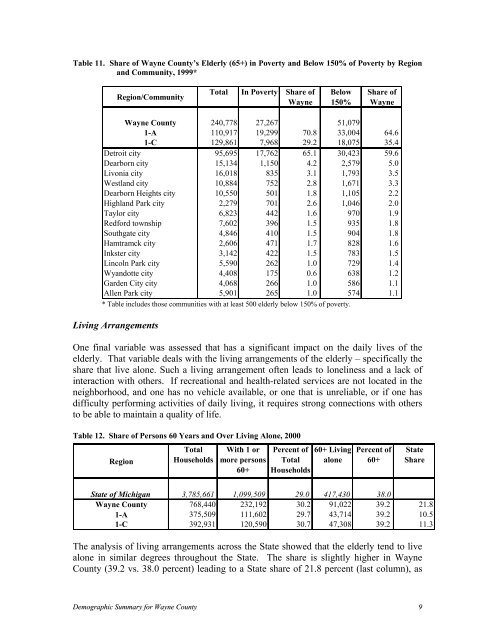
Table 11. Share <strong>of</strong> <strong>Wayne</strong> <strong>County</strong>’s Elderly (65+) <strong>in</strong> Poverty and Below 150% <strong>of</strong> Poverty by Region<br />
and Community, 1999*<br />
Region/Community<br />
Total In Poverty Share <strong>of</strong><br />
<strong>Wayne</strong><br />
Below<br />
150%<br />
Share <strong>of</strong><br />
<strong>Wayne</strong><br />
<strong>Wayne</strong> <strong>County</strong> 240,778 27,267 51,079<br />
1-A 110,917 19,299 70.8 33,004 64.6<br />
1-C 129,861 7,968 29.2 18,075 35.4<br />
Detroit city 95,695 17,762 65.1 30,423 59.6<br />
Dearborn city 15,134 1,150 4.2 2,579 5.0<br />
Livonia city 16,018 835 3.1 1,793 3.5<br />
Westland city 10,884 752 2.8 1,671 3.3<br />
Dearborn Heights city 10,550 501 1.8 1,105 2.2<br />
Highland Park city 2,279 701 2.6 1,046 2.0<br />
Taylor city 6,823 442 1.6 970 1.9<br />
Redford township 7,602 396 1.5 935 1.8<br />
Southgate city 4,846 410 1.5 904 1.8<br />
Hamtramck city 2,606 471 1.7 828 1.6<br />
Inkster city 3,142 422 1.5 783 1.5<br />
L<strong>in</strong>coln Park city 5,590 262 1.0 729 1.4<br />
Wyandotte city 4,408 175 0.6 638 1.2<br />
Garden City city 4,068 266 1.0 586 1.1<br />
Allen Park city 5,901 265 1.0 574 1.1<br />
* Table <strong>in</strong>cludes those communities with at least 500 elderly below 150% <strong>of</strong> poverty.<br />
Liv<strong>in</strong>g Arrangements<br />
One f<strong>in</strong>al variable was assessed that has a significant impact on the daily lives <strong>of</strong> the<br />
elderly. That variable deals with the liv<strong>in</strong>g arrangements <strong>of</strong> the elderly – specifically the<br />
share that live alone. Such a liv<strong>in</strong>g arrangement <strong>of</strong>ten leads to lonel<strong>in</strong>ess and a lack <strong>of</strong><br />
<strong>in</strong>teraction with others. If recreational and health-related services are not located <strong>in</strong> the<br />
neighborhood, and one has no vehicle available, or one that is unreliable, or if one has<br />
difficulty perform<strong>in</strong>g activities <strong>of</strong> daily liv<strong>in</strong>g, it requires strong connections with others<br />
to be able to ma<strong>in</strong>ta<strong>in</strong> a quality <strong>of</strong> life.<br />
Table 12. Share <strong>of</strong> Persons 60 Years and Over Liv<strong>in</strong>g Alone, 2000<br />
Region<br />
Total<br />
Households<br />
With 1 or<br />
more persons<br />
60+<br />
Percent <strong>of</strong><br />
Total<br />
Households<br />
60+ Liv<strong>in</strong>g<br />
alone<br />
Percent <strong>of</strong><br />
60+<br />
State<br />
Share<br />
State <strong>of</strong> <strong>Michigan</strong> 3,785,661 1,099,509 29.0 417,430 38.0<br />
<strong>Wayne</strong> <strong>County</strong> 768,440 232,192 30.2 91,022 39.2 21.8<br />
1-A 375,509 111,602 29.7 43,714 39.2 10.5<br />
1-C 392,931 120,590 30.7 47,308 39.2 11.3<br />
The analysis <strong>of</strong> liv<strong>in</strong>g arrangements across the State showed that the elderly tend to live<br />
alone <strong>in</strong> similar degrees throughout the State. The share is slightly higher <strong>in</strong> <strong>Wayne</strong><br />
<strong>County</strong> (39.2 vs. 38.0 percent) lead<strong>in</strong>g to a State share <strong>of</strong> 21.8 percent (last column), as<br />
<strong>Demographic</strong> Summary for <strong>Wayne</strong> <strong>County</strong> 9


