

Demographic Profile of Senior in Wayne County, Michigan
Demographic Profile of Senior in Wayne County, Michigan
Demographic Profile of Senior in Wayne County, Michigan

You also want an ePaper? Increase the reach of your titles
YUMPU automatically turns print PDFs into web optimized ePapers that Google loves.
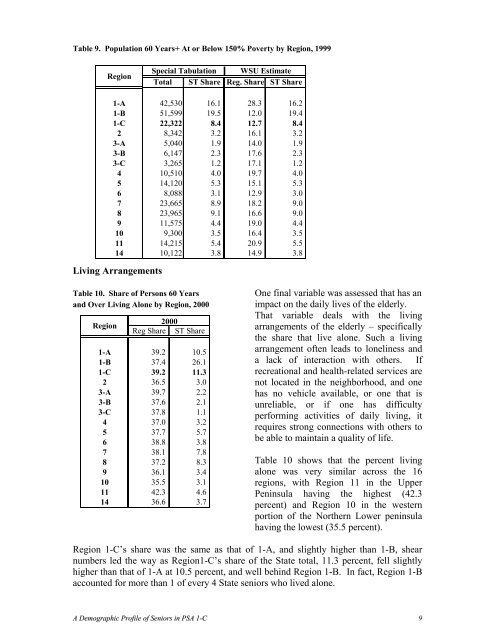
Table 9. Population 60 Years+ At or Below 150% Poverty by Region, 1999<br />
Region<br />
Special Tabulation WSU Estimate<br />
Total ST Share Reg. Share ST Share<br />
1-A 42,530 16.1 28.3 16.2<br />
1-B 51,599 19.5 12.0 19.4<br />
1-C 22,322 8.4 12.7 8.4<br />
2 8,342 3.2 16.1 3.2<br />
3-A 5,040 1.9 14.0 1.9<br />
3-B 6,147 2.3 17.6 2.3<br />
3-C 3,265 1.2 17.1 1.2<br />
4 10,510 4.0 19.7 4.0<br />
5 14,120 5.3 15.1 5.3<br />
6 8,088 3.1 12.9 3.0<br />
7 23,665 8.9 18.2 9.0<br />
8 23,965 9.1 16.6 9.0<br />
9 11,575 4.4 19.0 4.4<br />
10 9,300 3.5 16.4 3.5<br />
11 14,215 5.4 20.9 5.5<br />
14 10,122 3.8 14.9 3.8<br />
Liv<strong>in</strong>g Arrangements<br />
Table 10. Share <strong>of</strong> Persons 60 Years<br />
and Over Liv<strong>in</strong>g Alone by Region, 2000<br />
Region<br />
2000<br />
Reg Share ST Share<br />
1-A 39.2 10.5<br />
1-B 37.4 26.1<br />
1-C 39.2 11.3<br />
2 36.5 3.0<br />
3-A 39.7 2.2<br />
3-B 37.6 2.1<br />
3-C 37.8 1.1<br />
4 37.0 3.2<br />
5 37.7 5.7<br />
6 38.8 3.8<br />
7 38.1 7.8<br />
8 37.2 8.3<br />
9 36.1 3.4<br />
10 35.5 3.1<br />
11 42.3 4.6<br />
14 36.6 3.7<br />
One f<strong>in</strong>al variable was assessed that has an<br />
impact on the daily lives <strong>of</strong> the elderly.<br />
That variable deals with the liv<strong>in</strong>g<br />
arrangements <strong>of</strong> the elderly – specifically<br />
the share that live alone. Such a liv<strong>in</strong>g<br />
arrangement <strong>of</strong>ten leads to lonel<strong>in</strong>ess and<br />
a lack <strong>of</strong> <strong>in</strong>teraction with others. If<br />
recreational and health-related services are<br />
not located <strong>in</strong> the neighborhood, and one<br />
has no vehicle available, or one that is<br />
unreliable, or if one has difficulty<br />
perform<strong>in</strong>g activities <strong>of</strong> daily liv<strong>in</strong>g, it<br />
requires strong connections with others to<br />
be able to ma<strong>in</strong>ta<strong>in</strong> a quality <strong>of</strong> life.<br />
Table 10 shows that the percent liv<strong>in</strong>g<br />
alone was very similar across the 16<br />
regions, with Region 11 <strong>in</strong> the Upper<br />
Pen<strong>in</strong>sula hav<strong>in</strong>g the highest (42.3<br />
percent) and Region 10 <strong>in</strong> the western<br />
portion <strong>of</strong> the Northern Lower pen<strong>in</strong>sula<br />
hav<strong>in</strong>g the lowest (35.5 percent).<br />
Region 1-C’s share was the same as that <strong>of</strong> 1-A, and slightly higher than 1-B, shear<br />
numbers led the way as Region1-C’s share <strong>of</strong> the State total, 11.3 percent, fell slightly<br />
higher than that <strong>of</strong> 1-A at 10.5 percent, and well beh<strong>in</strong>d Region 1-B. In fact, Region 1-B<br />
accounted for more than 1 <strong>of</strong> every 4 State seniors who lived alone.<br />
A <strong>Demographic</strong> <strong>Pr<strong>of</strong>ile</strong> <strong>of</strong> <strong>Senior</strong>s <strong>in</strong> PSA 1-C 9


