

Demographic Profile of Senior in Wayne County, Michigan
Demographic Profile of Senior in Wayne County, Michigan
Demographic Profile of Senior in Wayne County, Michigan

You also want an ePaper? Increase the reach of your titles
YUMPU automatically turns print PDFs into web optimized ePapers that Google loves.
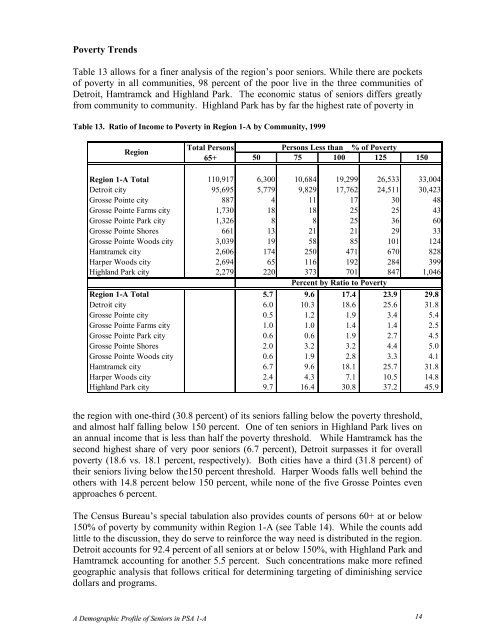
Poverty Trends<br />
Table 13 allows for a f<strong>in</strong>er analysis <strong>of</strong> the region’s poor seniors. While there are pockets<br />
<strong>of</strong> poverty <strong>in</strong> all communities, 98 percent <strong>of</strong> the poor live <strong>in</strong> the three communities <strong>of</strong><br />
Detroit, Hamtramck and Highland Park. The economic status <strong>of</strong> seniors differs greatly<br />
from community to community. Highland Park has by far the highest rate <strong>of</strong> poverty <strong>in</strong><br />
Table 13. Ratio <strong>of</strong> Income to Poverty <strong>in</strong> Region 1-A by Community, 1999<br />
Region<br />
Total Persons<br />
65+<br />
Persons Less than _ % <strong>of</strong> Poverty<br />
50 75 100 125 150<br />
Region 1-A Total 110,917 6,300 10,684 19,299 26,533 33,004<br />
Detroit city 95,695 5,779 9,829 17,762 24,511 30,423<br />
Grosse Po<strong>in</strong>te city 887 4 11 17 30 48<br />
Grosse Po<strong>in</strong>te Farms city 1,730 18 18 25 25 43<br />
Grosse Po<strong>in</strong>te Park city 1,326 8 8 25 36 60<br />
Grosse Po<strong>in</strong>te Shores 661 13 21 21 29 33<br />
Grosse Po<strong>in</strong>te Woods city 3,039 19 58 85 101 124<br />
Hamtramck city 2,606 174 250 471 670 828<br />
Harper Woods city 2,694 65 116 192 284 399<br />
Highland Park city 2,279 220 373 701 847 1,046<br />
Percent by Ratio to Poverty<br />
Region 1-A Total 5.7 9.6 17.4 23.9 29.8<br />
Detroit city 6.0 10.3 18.6 25.6 31.8<br />
Grosse Po<strong>in</strong>te city 0.5 1.2 1.9 3.4 5.4<br />
Grosse Po<strong>in</strong>te Farms city 1.0 1.0 1.4 1.4 2.5<br />
Grosse Po<strong>in</strong>te Park city 0.6 0.6 1.9 2.7 4.5<br />
Grosse Po<strong>in</strong>te Shores 2.0 3.2 3.2 4.4 5.0<br />
Grosse Po<strong>in</strong>te Woods city 0.6 1.9 2.8 3.3 4.1<br />
Hamtramck city 6.7 9.6 18.1 25.7 31.8<br />
Harper Woods city 2.4 4.3 7.1 10.5 14.8<br />
Highland Park city 9.7 16.4 30.8 37.2 45.9<br />
the region with one-third (30.8 percent) <strong>of</strong> its seniors fall<strong>in</strong>g below the poverty threshold,<br />
and almost half fall<strong>in</strong>g below 150 percent. One <strong>of</strong> ten seniors <strong>in</strong> Highland Park lives on<br />
an annual <strong>in</strong>come that is less than half the poverty threshold. While Hamtramck has the<br />
second highest share <strong>of</strong> very poor seniors (6.7 percent), Detroit surpasses it for overall<br />
poverty (18.6 vs. 18.1 percent, respectively). Both cities have a third (31.8 percent) <strong>of</strong><br />
their seniors liv<strong>in</strong>g below the150 percent threshold. Harper Woods falls well beh<strong>in</strong>d the<br />
others with 14.8 percent below 150 percent, while none <strong>of</strong> the five Grosse Po<strong>in</strong>tes even<br />
approaches 6 percent.<br />
The Census Bureau’s special tabulation also provides counts <strong>of</strong> persons 60+ at or below<br />
150% <strong>of</strong> poverty by community with<strong>in</strong> Region 1-A (see Table 14). While the counts add<br />
little to the discussion, they do serve to re<strong>in</strong>force the way need is distributed <strong>in</strong> the region.<br />
Detroit accounts for 92.4 percent <strong>of</strong> all seniors at or below 150%, with Highland Park and<br />
Hamtramck account<strong>in</strong>g for another 5.5 percent. Such concentrations make more ref<strong>in</strong>ed<br />
geographic analysis that follows critical for determ<strong>in</strong><strong>in</strong>g target<strong>in</strong>g <strong>of</strong> dim<strong>in</strong>ish<strong>in</strong>g service<br />
dollars and programs.<br />
A <strong>Demographic</strong> <strong>Pr<strong>of</strong>ile</strong> <strong>of</strong> <strong>Senior</strong>s <strong>in</strong> PSA 1-A 14


