

Demographic Profile of Senior in Wayne County, Michigan
Demographic Profile of Senior in Wayne County, Michigan
Demographic Profile of Senior in Wayne County, Michigan

Create successful ePaper yourself
Turn your PDF publications into a flip-book with our unique Google optimized e-Paper software.
m<strong>in</strong>ority elderly population, 68 percent <strong>of</strong> the State’s African American seniors resided<br />
there, followed by 30 percent <strong>of</strong> Multi-race, 27 percent <strong>of</strong> Other race, 24 percent <strong>of</strong> Asian<br />
and Pacific Islanders, and 17 percent <strong>of</strong> Native Americans. While not <strong>in</strong>cluded <strong>in</strong> the<br />
calculations <strong>of</strong> m<strong>in</strong>ority seniors, it should be noted that both Hispanics and Arab<br />
Americans comprise grow<strong>in</strong>g segments <strong>of</strong> the county’s elderly population. <strong>Wayne</strong><br />
<strong>County</strong> conta<strong>in</strong>ed 37 percent <strong>of</strong> the State’s Arab American seniors and 29 percent <strong>of</strong> it<br />
Lat<strong>in</strong>o/Hispanic seniors. M<strong>in</strong>ority seniors accounted for 37 percent <strong>of</strong> all seniors <strong>in</strong><br />
<strong>Wayne</strong> <strong>County</strong>, with African Americans represent<strong>in</strong>g 92.5 percent <strong>of</strong> this total.<br />
<strong>Wayne</strong> <strong>County</strong> Shares <strong>of</strong> State’s M<strong>in</strong>ority <strong>Senior</strong>s by Detailed Group, 2000<br />
<strong>Michigan</strong><br />
<strong>Wayne</strong><br />
<strong>County</strong><br />
Share <strong>of</strong><br />
State<br />
Share <strong>of</strong><br />
<strong>County</strong><br />
<strong>Senior</strong>s<br />
M<strong>in</strong>ority<br />
Share with<strong>in</strong><br />
<strong>Wayne</strong><br />
<strong>County</strong><br />
Total M<strong>in</strong>ority 195,459 118,041 60.4% 37.0%<br />
African American 160,741 109,175 67.9% 34.2% 92.5%<br />
Native American 4,658 776 16.7% 0.2% 0.7%<br />
Asian and Pacific Islander 12,298 2,913 23.7% 0.9% 2.5%<br />
Other Race 5,260 1,428 27.1% 0.4% 1.2%<br />
Multi-Race 12,502 3,749 30.0% 1.2% 3.2%<br />
Hispanic 18,653 5,379 28.8% 1.7% 4.6%<br />
Arab American 10,047 3,718 37.0% 1.2% 3.1%<br />
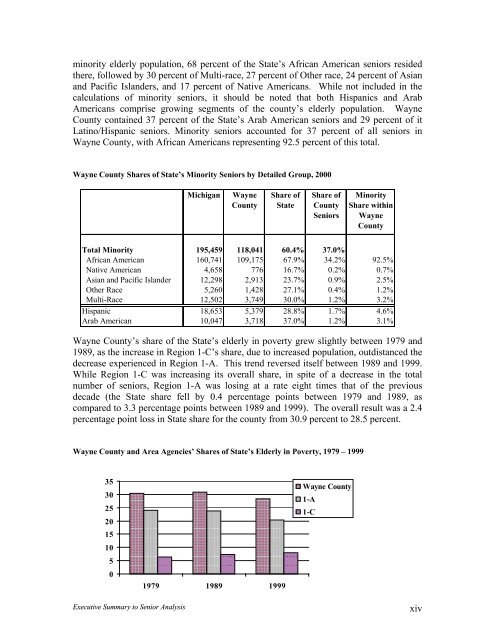
<strong>Wayne</strong> <strong>County</strong>’s share <strong>of</strong> the State’s elderly <strong>in</strong> poverty grew slightly between 1979 and<br />
1989, as the <strong>in</strong>crease <strong>in</strong> Region 1-C’s share, due to <strong>in</strong>creased population, outdistanced the<br />
decrease experienced <strong>in</strong> Region 1-A. This trend reversed itself between 1989 and 1999.<br />
While Region 1-C was <strong>in</strong>creas<strong>in</strong>g its overall share, <strong>in</strong> spite <strong>of</strong> a decrease <strong>in</strong> the total<br />
number <strong>of</strong> seniors, Region 1-A was los<strong>in</strong>g at a rate eight times that <strong>of</strong> the previous<br />
decade (the State share fell by 0.4 percentage po<strong>in</strong>ts between 1979 and 1989, as<br />
compared to 3.3 percentage po<strong>in</strong>ts between 1989 and 1999). The overall result was a 2.4<br />
percentage po<strong>in</strong>t loss <strong>in</strong> State share for the county from 30.9 percent to 28.5 percent.<br />
<strong>Wayne</strong> <strong>County</strong> and Area Agencies’ Shares <strong>of</strong> State’s Elderly <strong>in</strong> Poverty, 1979 – 1999<br />
35<br />
30<br />
25<br />
20<br />
15<br />
10<br />
5<br />
0<br />
1979 1989 1999<br />
<strong>Wayne</strong> <strong>County</strong><br />
1-A<br />
1-C<br />
Executive Summary to <strong>Senior</strong> Analysis<br />
xiv


