Demographic Profile of Senior in Wayne County, Michigan
Demographic Profile of Senior in Wayne County, Michigan
Demographic Profile of Senior in Wayne County, Michigan
Create successful ePaper yourself
Turn your PDF publications into a flip-book with our unique Google optimized e-Paper software.
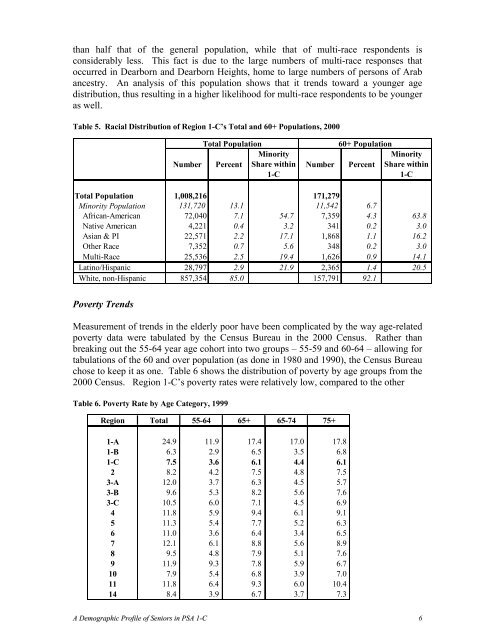
than half that <strong>of</strong> the general population, while that <strong>of</strong> multi-race respondents is<br />
considerably less. This fact is due to the large numbers <strong>of</strong> multi-race responses that<br />
occurred <strong>in</strong> Dearborn and Dearborn Heights, home to large numbers <strong>of</strong> persons <strong>of</strong> Arab<br />
ancestry. An analysis <strong>of</strong> this population shows that it trends toward a younger age<br />
distribution, thus result<strong>in</strong>g <strong>in</strong> a higher likelihood for multi-race respondents to be younger<br />
as well.<br />
Table 5. Racial Distribution <strong>of</strong> Region 1-C’s Total and 60+ Populations, 2000<br />
Number<br />
Total Population<br />
M<strong>in</strong>ority<br />
Percent Share with<strong>in</strong><br />
1-C<br />
Number<br />
60+ Population<br />
M<strong>in</strong>ority<br />
Percent Share with<strong>in</strong><br />
1-C<br />
Total Population 1,008,216 171,279<br />
M<strong>in</strong>ority Population 131,720 13.1 11,542 6.7<br />
African-American 72,040 7.1 54.7 7,359 4.3 63.8<br />
Native American 4,221 0.4 3.2 341 0.2 3.0<br />
Asian & PI 22,571 2.2 17.1 1,868 1.1 16.2<br />
Other Race 7,352 0.7 5.6 348 0.2 3.0<br />
Multi-Race 25,536 2.5 19.4 1,626 0.9 14.1<br />
Lat<strong>in</strong>o/Hispanic 28,797 2.9 21.9 2,365 1.4 20.5<br />
White, non-Hispanic 857,354 85.0 157,791 92.1<br />
Poverty Trends<br />
Measurement <strong>of</strong> trends <strong>in</strong> the elderly poor have been complicated by the way age-related<br />
poverty data were tabulated by the Census Bureau <strong>in</strong> the 2000 Census. Rather than<br />
break<strong>in</strong>g out the 55-64 year age cohort <strong>in</strong>to two groups – 55-59 and 60-64 – allow<strong>in</strong>g for<br />
tabulations <strong>of</strong> the 60 and over population (as done <strong>in</strong> 1980 and 1990), the Census Bureau<br />
chose to keep it as one. Table 6 shows the distribution <strong>of</strong> poverty by age groups from the<br />
2000 Census. Region 1-C’s poverty rates were relatively low, compared to the other<br />
Table 6. Poverty Rate by Age Category, 1999<br />
Region Total 55-64 65+ 65-74 75+<br />
1-A 24.9 11.9 17.4 17.0 17.8<br />
1-B 6.3 2.9 6.5 3.5 6.8<br />
1-C 7.5 3.6 6.1 4.4 6.1<br />
2 8.2 4.2 7.5 4.8 7.5<br />
3-A 12.0 3.7 6.3 4.5 5.7<br />
3-B 9.6 5.3 8.2 5.6 7.6<br />
3-C 10.5 6.0 7.1 4.5 6.9<br />
4 11.8 5.9 9.4 6.1 9.1<br />
5 11.3 5.4 7.7 5.2 6.3<br />
6 11.0 3.6 6.4 3.4 6.5<br />
7 12.1 6.1 8.8 5.6 8.9<br />
8 9.5 4.8 7.9 5.1 7.6<br />
9 11.9 9.3 7.8 5.9 6.7<br />
10 7.9 5.4 6.8 3.9 7.0<br />
11 11.8 6.4 9.3 6.0 10.4<br />
14 8.4 3.9 6.7 3.7 7.3<br />
A <strong>Demographic</strong> <strong>Pr<strong>of</strong>ile</strong> <strong>of</strong> <strong>Senior</strong>s <strong>in</strong> PSA 1-C 6


