

Demographic Profile of Senior in Wayne County, Michigan
Demographic Profile of Senior in Wayne County, Michigan
Demographic Profile of Senior in Wayne County, Michigan

Create successful ePaper yourself
Turn your PDF publications into a flip-book with our unique Google optimized e-Paper software.
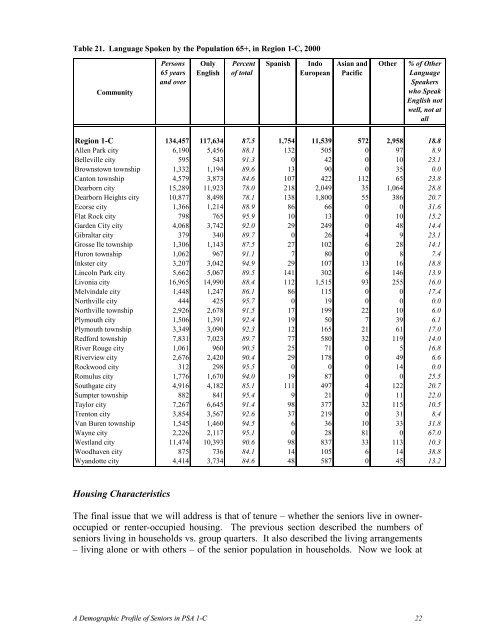
Table 21. Language Spoken by the Population 65+, <strong>in</strong> Region 1-C, 2000<br />
Community<br />
Persons<br />
65 years<br />
and over<br />
Only<br />
English<br />
Percent<br />
<strong>of</strong> total<br />
Spanish<br />
Indo<br />
European<br />
Asian and<br />
Pacific<br />
Other<br />
% <strong>of</strong> Other<br />
Language<br />
Speakers<br />
who Speak<br />
English not<br />
well, not at<br />
all<br />
Region 1-C 134,457 117,634 87.5 1,754 11,539 572 2,958 18.8<br />
Allen Park city 6,190 5,456 88.1 132 505 0 97 8.9<br />
Belleville city 595 543 91.3 0 42 0 10 23.1<br />
Brownstown township 1,332 1,194 89.6 13 90 0 35 0.0<br />
Canton township 4,579 3,873 84.6 107 422 112 65 23.8<br />
Dearborn city 15,289 11,923 78.0 218 2,049 35 1,064 28.8<br />
Dearborn Heights city 10,877 8,498 78.1 138 1,800 55 386 20.7<br />
Ecorse city 1,366 1,214 88.9 86 66 0 0 31.6<br />
Flat Rock city 798 765 95.9 10 13 0 10 15.2<br />
Garden City city 4,068 3,742 92.0 29 249 0 48 14.4<br />
Gibraltar city 379 340 89.7 0 26 4 9 23.1<br />
Grosse Ile township 1,306 1,143 87.5 27 102 6 28 14.1<br />
Huron township 1,062 967 91.1 7 80 0 8 7.4<br />
Inkster city 3,207 3,042 94.9 29 107 13 16 18.8<br />
L<strong>in</strong>coln Park city 5,662 5,067 89.5 141 302 6 146 13.9<br />
Livonia city 16,965 14,990 88.4 112 1,515 93 255 16.0<br />
Melv<strong>in</strong>dale city 1,448 1,247 86.1 86 115 0 0 17.4<br />
Northville city 444 425 95.7 0 19 0 0 0.0<br />
Northville township 2,926 2,678 91.5 17 199 22 10 6.0<br />
Plymouth city 1,506 1,391 92.4 19 50 7 39 6.1<br />
Plymouth township 3,349 3,090 92.3 12 165 21 61 17.0<br />
Redford township 7,831 7,023 89.7 77 580 32 119 14.0<br />
River Rouge city 1,061 960 90.5 25 71 0 5 16.8<br />
Riverview city 2,676 2,420 90.4 29 178 0 49 6.6<br />
Rockwood city 312 298 95.5 0 0 0 14 0.0<br />
Romulus city 1,776 1,670 94.0 19 87 0 0 25.5<br />
Southgate city 4,916 4,182 85.1 111 497 4 122 20.7<br />
Sumpter township 882 841 95.4 9 21 0 11 22.0<br />
Taylor city 7,267 6,645 91.4 98 377 32 115 10.5<br />
Trenton city 3,854 3,567 92.6 37 219 0 31 8.4<br />
Van Buren township 1,545 1,460 94.5 6 36 10 33 31.8<br />
<strong>Wayne</strong> city 2,226 2,117 95.1 0 28 81 0 67.0<br />
Westland city 11,474 10,393 90.6 98 837 33 113 10.3<br />
Woodhaven city 875 736 84.1 14 105 6 14 38.8<br />
Wyandotte city 4,414 3,734 84.6 48 587 0 45 13.2<br />
Hous<strong>in</strong>g Characteristics<br />
The f<strong>in</strong>al issue that we will address is that <strong>of</strong> tenure – whether the seniors live <strong>in</strong> owneroccupied<br />
or renter-occupied hous<strong>in</strong>g. The previous section described the numbers <strong>of</strong><br />
seniors liv<strong>in</strong>g <strong>in</strong> households vs. group quarters. It also described the liv<strong>in</strong>g arrangements<br />
– liv<strong>in</strong>g alone or with others – <strong>of</strong> the senior population <strong>in</strong> households. Now we look at<br />
A <strong>Demographic</strong> <strong>Pr<strong>of</strong>ile</strong> <strong>of</strong> <strong>Senior</strong>s <strong>in</strong> PSA 1-C 22


