

Demographic Profile of Senior in Wayne County, Michigan
Demographic Profile of Senior in Wayne County, Michigan
Demographic Profile of Senior in Wayne County, Michigan

Create successful ePaper yourself
Turn your PDF publications into a flip-book with our unique Google optimized e-Paper software.
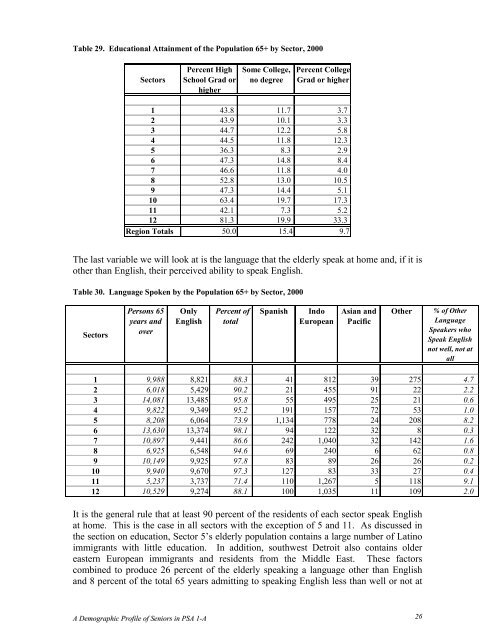
Table 29. Educational Atta<strong>in</strong>ment <strong>of</strong> the Population 65+ by Sector, 2000<br />
Sectors<br />
Percent High<br />
School Grad or<br />
higher<br />
Some College,<br />
no degree<br />
Percent College<br />
Grad or higher<br />
1 43.8 11.7 3.7<br />
2 43.9 10.1 3.3<br />
3 44.7 12.2 5.8<br />
4 44.5 11.8 12.3<br />
5 36.3 8.3 2.9<br />
6 47.3 14.8 8.4<br />
7 46.6 11.8 4.0<br />
8 52.8 13.0 10.5<br />
9 47.3 14.4 5.1<br />
10 63.4 19.7 17.3<br />
11 42.1 7.3 5.2<br />
12 81.3 19.9 33.3<br />
Region Totals 50.0 15.4 9.7<br />
The last variable we will look at is the language that the elderly speak at home and, if it is<br />
other than English, their perceived ability to speak English.<br />
Table 30. Language Spoken by the Population 65+ by Sector, 2000<br />
Sectors<br />
Persons 65<br />
years and<br />
over<br />
Only<br />
English<br />
Percent <strong>of</strong><br />
total<br />
Spanish<br />
Indo<br />
European<br />
Asian and<br />
Pacific<br />
Other<br />
% <strong>of</strong> Other<br />
Language<br />
Speakers who<br />
Speak English<br />
not well, not at<br />
all<br />
1 9,988 8,821 88.3 41 812 39 275 4.7<br />
2 6,018 5,429 90.2 21 455 91 22 2.2<br />
3 14,081 13,485 95.8 55 495 25 21 0.6<br />
4 9,822 9,349 95.2 191 157 72 53 1.0<br />
5 8,208 6,064 73.9 1,134 778 24 208 8.2<br />
6 13,630 13,374 98.1 94 122 32 8 0.3<br />
7 10,897 9,441 86.6 242 1,040 32 142 1.6<br />
8 6,925 6,548 94.6 69 240 6 62 0.8<br />
9 10,149 9,925 97.8 83 89 26 26 0.2<br />
10 9,940 9,670 97.3 127 83 33 27 0.4<br />
11 5,237 3,737 71.4 110 1,267 5 118 9.1<br />
12 10,529 9,274 88.1 100 1,035 11 109 2.0<br />
It is the general rule that at least 90 percent <strong>of</strong> the residents <strong>of</strong> each sector speak English<br />
at home. This is the case <strong>in</strong> all sectors with the exception <strong>of</strong> 5 and 11. As discussed <strong>in</strong><br />
the section on education, Sector 5’s elderly population conta<strong>in</strong>s a large number <strong>of</strong> Lat<strong>in</strong>o<br />
immigrants with little education. In addition, southwest Detroit also conta<strong>in</strong>s older<br />
eastern European immigrants and residents from the Middle East. These factors<br />
comb<strong>in</strong>ed to produce 26 percent <strong>of</strong> the elderly speak<strong>in</strong>g a language other than English<br />
and 8 percent <strong>of</strong> the total 65 years admitt<strong>in</strong>g to speak<strong>in</strong>g English less than well or not at<br />
A <strong>Demographic</strong> <strong>Pr<strong>of</strong>ile</strong> <strong>of</strong> <strong>Senior</strong>s <strong>in</strong> PSA 1-A 276


