

Demographic Profile of Senior in Wayne County, Michigan
Demographic Profile of Senior in Wayne County, Michigan
Demographic Profile of Senior in Wayne County, Michigan

You also want an ePaper? Increase the reach of your titles
YUMPU automatically turns print PDFs into web optimized ePapers that Google loves.
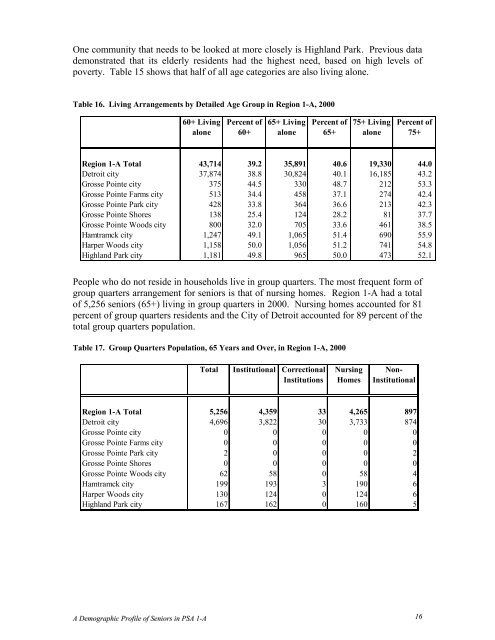
One community that needs to be looked at more closely is Highland Park. Previous data<br />
demonstrated that its elderly residents had the highest need, based on high levels <strong>of</strong><br />
poverty. Table 15 shows that half <strong>of</strong> all age categories are also liv<strong>in</strong>g alone.<br />
Table 16. Liv<strong>in</strong>g Arrangements by Detailed Age Group <strong>in</strong> Region 1-A, 2000<br />
60+ Liv<strong>in</strong>g<br />
alone<br />
Percent <strong>of</strong><br />
60+<br />
65+ Liv<strong>in</strong>g<br />
alone<br />
Percent <strong>of</strong><br />
65+<br />
75+ Liv<strong>in</strong>g<br />
alone<br />
Percent <strong>of</strong><br />
75+<br />
Region 1-A Total 43,714 39.2 35,891 40.6 19,330 44.0<br />
Detroit city 37,874 38.8 30,824 40.1 16,185 43.2<br />
Grosse Po<strong>in</strong>te city 375 44.5 330 48.7 212 53.3<br />
Grosse Po<strong>in</strong>te Farms city 513 34.4 458 37.1 274 42.4<br />
Grosse Po<strong>in</strong>te Park city 428 33.8 364 36.6 213 42.3<br />
Grosse Po<strong>in</strong>te Shores 138 25.4 124 28.2 81 37.7<br />
Grosse Po<strong>in</strong>te Woods city 800 32.0 705 33.6 461 38.5<br />
Hamtramck city 1,247 49.1 1,065 51.4 690 55.9<br />
Harper Woods city 1,158 50.0 1,056 51.2 741 54.8<br />
Highland Park city 1,181 49.8 965 50.0 473 52.1<br />
People who do not reside <strong>in</strong> households live <strong>in</strong> group quarters. The most frequent form <strong>of</strong><br />
group quarters arrangement for seniors is that <strong>of</strong> nurs<strong>in</strong>g homes. Region 1-A had a total<br />
<strong>of</strong> 5,256 seniors (65+) liv<strong>in</strong>g <strong>in</strong> group quarters <strong>in</strong> 2000. Nurs<strong>in</strong>g homes accounted for 81<br />
percent <strong>of</strong> group quarters residents and the City <strong>of</strong> Detroit accounted for 89 percent <strong>of</strong> the<br />
total group quarters population.<br />
Table 17. Group Quarters Population, 65 Years and Over, <strong>in</strong> Region 1-A, 2000<br />
Total<br />
Institutional Correctional<br />
Institutions<br />
Nurs<strong>in</strong>g<br />
Homes<br />
Non-<br />
Institutional<br />
Region 1-A Total 5,256 4,359 33 4,265 897<br />
Detroit city 4,696 3,822 30 3,733 874<br />
Grosse Po<strong>in</strong>te city 0 0 0 0 0<br />
Grosse Po<strong>in</strong>te Farms city 0 0 0 0 0<br />
Grosse Po<strong>in</strong>te Park city 2 0 0 0 2<br />
Grosse Po<strong>in</strong>te Shores 0 0 0 0 0<br />
Grosse Po<strong>in</strong>te Woods city 62 58 0 58 4<br />
Hamtramck city 199 193 3 190 6<br />
Harper Woods city 130 124 0 124 6<br />
Highland Park city 167 162 0 160 5<br />
A <strong>Demographic</strong> <strong>Pr<strong>of</strong>ile</strong> <strong>of</strong> <strong>Senior</strong>s <strong>in</strong> PSA 1-A 16


