

Demographic Profile of Senior in Wayne County, Michigan
Demographic Profile of Senior in Wayne County, Michigan
Demographic Profile of Senior in Wayne County, Michigan

Create successful ePaper yourself
Turn your PDF publications into a flip-book with our unique Google optimized e-Paper software.
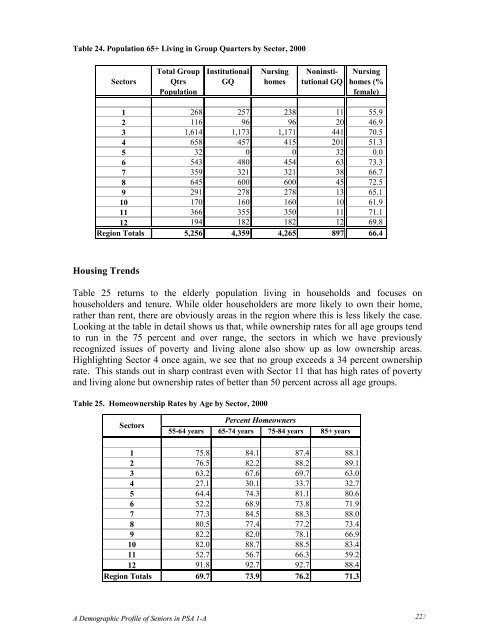
Table 24. Population 65+ Liv<strong>in</strong>g <strong>in</strong> Group Quarters by Sector, 2000<br />
Sectors<br />
Total Group<br />
Qtrs<br />
Population<br />
Institutional<br />
GQ<br />
Nurs<strong>in</strong>g<br />
homes<br />
Non<strong>in</strong>stitutional<br />
GQ<br />
Nurs<strong>in</strong>g<br />
homes (%<br />
female)<br />
1 268 257 238 11 55.9<br />
2 116 96 96 20 46.9<br />
3 1,614 1,173 1,171 441 70.5<br />
4 658 457 415 201 51.3<br />
5 32 0 0 32 0.0<br />
6 543 480 454 63 73.3<br />
7 359 321 321 38 66.7<br />
8 645 600 600 45 72.5<br />
9 291 278 278 13 65.1<br />
10 170 160 160 10 61.9<br />
11 366 355 350 11 71.1<br />
12 194 182 182 12 69.8<br />
Region Totals 5,256 4,359 4,265 897 66.4<br />
Hous<strong>in</strong>g Trends<br />
Table 25 returns to the elderly population liv<strong>in</strong>g <strong>in</strong> households and focuses on<br />
householders and tenure. While older householders are more likely to own their home,<br />
rather than rent, there are obviously areas <strong>in</strong> the region where this is less likely the case.<br />
Look<strong>in</strong>g at the table <strong>in</strong> detail shows us that, while ownership rates for all age groups tend<br />
to run <strong>in</strong> the 75 percent and over range, the sectors <strong>in</strong> which we have previously<br />
recognized issues <strong>of</strong> poverty and liv<strong>in</strong>g alone also show up as low ownership areas.<br />
Highlight<strong>in</strong>g Sector 4 once aga<strong>in</strong>, we see that no group exceeds a 34 percent ownership<br />
rate. This stands out <strong>in</strong> sharp contrast even with Sector 11 that has high rates <strong>of</strong> poverty<br />
and liv<strong>in</strong>g alone but ownership rates <strong>of</strong> better than 50 percent across all age groups.<br />
Table 25. Homeownership Rates by Age by Sector, 2000<br />
Sectors<br />
Percent Homeowners<br />
55-64 years 65-74 years 75-84 years 85+ years<br />
1 75.8 84.1 87.4 88.1<br />
2 76.5 82.2 88.2 89.1<br />
3 63.2 67.6 69.7 63.0<br />
4 27.1 30.1 33.7 32.7<br />
5 64.4 74.3 81.1 80.6<br />
6 52.2 68.9 73.8 71.9<br />
7 77.3 84.5 88.3 88.0<br />
8 80.5 77.4 77.2 73.4<br />
9 82.2 82.0 78.1 66.9<br />
10 82.0 88.7 88.5 83.4<br />
11 52.7 56.7 66.3 59.2<br />
12 91.8 92.7 92.7 88.4<br />
Region Totals 69.7 73.9 76.2 71.3<br />
A <strong>Demographic</strong> <strong>Pr<strong>of</strong>ile</strong> <strong>of</strong> <strong>Senior</strong>s <strong>in</strong> PSA 1-A 2232


