

Demographic Profile of Senior in Wayne County, Michigan
Demographic Profile of Senior in Wayne County, Michigan
Demographic Profile of Senior in Wayne County, Michigan

You also want an ePaper? Increase the reach of your titles
YUMPU automatically turns print PDFs into web optimized ePapers that Google loves.
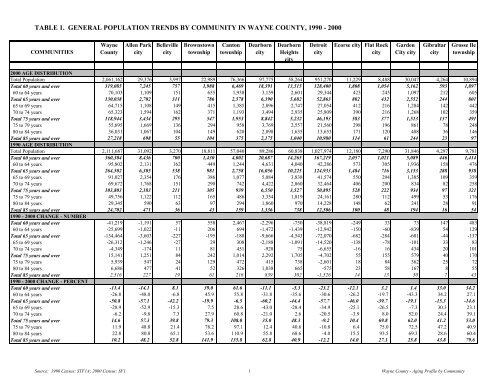
TABLE 1. GENERAL POPULATION TRENDS BY COMMUNITY IN WAYNE COUNTY, 1990 - 2000<br />
COMMUNITIES<br />
<strong>Wayne</strong><br />
<strong>County</strong><br />
Allen Park<br />
city<br />
Belleville<br />
city<br />
Brownstown<br />
township<br />
Canton<br />
township<br />
Dearborn<br />
city<br />
Dearborn<br />
Heights<br />
city<br />
Detroit<br />
city<br />
Ecorse city Flat Rock<br />
city<br />
Garden<br />
City city<br />
Gibraltar<br />
city<br />
Grosse Ile<br />
township<br />
2000 AGE DISTRIBUTION<br />
Total Population 2,061,162 29,376 3,997 22,989 76,366 97,775 58,264 951,270 11,229 8,488 30,047 4,264 10,894<br />
Total 60 years and over 319,085 7,245 757 1,988 6,469 18,391 13,515 128,400 1,808 1,054 5,162 593 1,897<br />
60 to 64 years 70,103 1,109 151 655 1,938 3,159 2,601 29,344 423 245 1,097 212 605<br />
Total 65 years and over 130,038 2,702 311 786 2,578 6,390 5,682 52,863 802 432 2,552 244 801<br />
65 to 69 years 64,715 1,108 149 415 1,385 2,896 2,747 27,054 412 216 1,284 142 442<br />
70 to 74 years 65,323 1,594 162 371 1,193 3,494 2,935 25,809 390 216 1,268 102 359<br />
Total 75 years and over 118,944 3,434 295 547 1,953 8,842 5,232 46,193 583 377 1,513 137 491<br />
75 to 79 years 55,695 1,669 136 294 958 3,769 2,557 21,560 298 196 861 78 248<br />
80 to 84 years 36,031 1,067 104 149 620 2,898 1,635 13,653 171 120 408 36 146<br />
Total 85 years and over 27,218 698 55 104 375 2,175 1,040 10,980 114 61 244 23 97<br />
1990 AGE DISTRIBUTION<br />
Total Population 2,111,687 31,092 3,270 18,811 57,040 89,286 60,838 1,027,974 12,180 7,290 31,846 4,297 9,781<br />
Total 60 years and over 360,304 8,436 700 1,430 4,002 20,687 14,265 167,219 2,057 1,021 5,089 446 1,414<br />
60 to 64 years 95,802 2,131 162 449 1,244 4,631 4,040 42,286 573 305 1,936 158 476<br />
Total 65 years and over 264,502 6,305 538 981 2,758 16,056 10,225 124,933 1,484 716 3,153 288 938<br />
65 to 69 years 91,027 2,354 176 386 1,077 5,084 3,838 41,574 550 294 1,385 109 359<br />
70 to 74 years 69,672 1,768 151 290 742 4,422 2,860 32,464 406 200 834 82 258<br />
Total 75 years and over 103,803 2,183 211 305 939 6,550 3,527 50,895 528 222 934 97 321<br />
75 to 79 years 49,756 1,122 112 165 486 3,354 1,819 24,161 280 112 499 53 176<br />
80 to 84 years 29,345 590 63 97 294 1,860 970 14,228 148 62 241 28 91<br />
Total 85 years and over 24,702 471 36 43 159 1,336 738 12,506 100 48 194 16 54<br />
1990 - 2000 CHANGE - NUMBER<br />
Total 60 years and over -41,219 -1,191 57 558 2,467 -2,296 -750 -38,819 -249 33 73 147 483<br />
60 to 64 years -25,699 -1,022 -11 206 694 -1,472 -1,439 -12,942 -150 -60 -839 54 129<br />
Total 65 years and over -134,464 -3,603 -227 -195 -180 -9,666 -4,543 -72,070 -682 -284 -601 -44 -137<br />
65 to 69 years -26,312 -1,246 -27 29 308 -2,188 -1,091 -14,520 -138 -78 -101 33 83<br />
70 to 74 years -4,349 -174 11 81 451 -928 75 -6,655 -16 16 434 20 101<br />
Total 75 years and over 15,141 1,251 84 242 1,014 2,292 1,705 -4,702 55 155 579 40 170<br />
75 to 79 years 5,939 547 24 129 472 415 738 -2,601 18 84 362 25 72<br />
80 to 84 years 6,686 477 41 52 326 1,038 665 -575 23 58 167 8 55<br />
Total 85 years and over 2,516 227 19 61 216 839 302 -1,526 14 13 50 7 43<br />
1990 - 2000 CHANGE - PERCENT<br />
Total 60 years and over -11.4 -14.1 8.1 39.0 61.6 -11.1 -5.3 -23.2 -12.1 3.2 1.4 33.0 34.2<br />
60 to 64 years -26.8 -48.0 -6.8 45.9 55.8 -31.8 -35.6 -30.6 -26.2 -19.7 -43.3 34.2 27.1<br />
Total 65 years and over -50.8 -57.1 -42.2 -19.9 -6.5 -60.2 -44.4 -57.7 -46.0 -39.7 -19.1 -15.3 -14.6<br />
65 to 69 years -28.9 -52.9 -15.3 7.5 28.6 -43.0 -28.4 -34.9 -25.1 -26.5 -7.3 30.3 23.1<br />
70 to 74 years -6.2 -9.8 7.3 27.9 60.8 -21.0 2.6 -20.5 -3.9 8.0 52.0 24.4 39.1<br />
Total 75 years and over 14.6 57.3 39.8 79.3 108.0 35.0 48.3 -9.2 10.4 69.8 62.0 41.2 53.0<br />
75 to 79 years 11.9 48.8 21.4 78.2 97.1 12.4 40.6 -10.8 6.4 75.0 72.5 47.2 40.9<br />
80 to 84 years 22.8 80.8 65.1 53.6 110.9 55.8 68.6 -4.0 15.5 93.5 69.3 28.6 60.4<br />
Total 85 years and over 10.2 48.2 52.8 141.9 135.8 62.8 40.9 -12.2 14.0 27.1 25.8 43.8 79.6<br />
Source: 1990 Census: STF1A; 2000 Census: SF1 1 <strong>Wayne</strong> <strong>County</strong> - Ag<strong>in</strong>g <strong>Pr<strong>of</strong>ile</strong> by Community


