

Demographic Profile of Senior in Wayne County, Michigan
Demographic Profile of Senior in Wayne County, Michigan
Demographic Profile of Senior in Wayne County, Michigan

Create successful ePaper yourself
Turn your PDF publications into a flip-book with our unique Google optimized e-Paper software.
account<strong>in</strong>g for just over half the total <strong>in</strong> <strong>Wayne</strong> <strong>County</strong>. While the numbers <strong>of</strong> Arabs, <strong>in</strong><br />
subgroups, for Region 1-A are usually too small to be detailed, the largest numbers come<br />
<strong>in</strong> for persons choos<strong>in</strong>g the general term <strong>of</strong> Arab/Arabic, followed by Lebanese.<br />
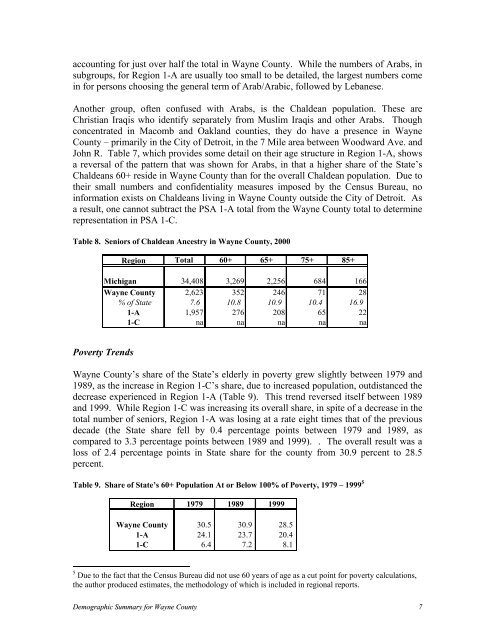
Another group, <strong>of</strong>ten confused with Arabs, is the Chaldean population. These are<br />
Christian Iraqis who identify separately from Muslim Iraqis and other Arabs. Though<br />
concentrated <strong>in</strong> Macomb and Oakland counties, they do have a presence <strong>in</strong> <strong>Wayne</strong><br />
<strong>County</strong> – primarily <strong>in</strong> the City <strong>of</strong> Detroit, <strong>in</strong> the 7 Mile area between Woodward Ave. and<br />
John R. Table 7, which provides some detail on their age structure <strong>in</strong> Region 1-A, shows<br />
a reversal <strong>of</strong> the pattern that was shown for Arabs, <strong>in</strong> that a higher share <strong>of</strong> the State’s<br />
Chaldeans 60+ reside <strong>in</strong> <strong>Wayne</strong> <strong>County</strong> than for the overall Chaldean population. Due to<br />
their small numbers and confidentiality measures imposed by the Census Bureau, no<br />
<strong>in</strong>formation exists on Chaldeans liv<strong>in</strong>g <strong>in</strong> <strong>Wayne</strong> <strong>County</strong> outside the City <strong>of</strong> Detroit. As<br />
a result, one cannot subtract the PSA 1-A total from the <strong>Wayne</strong> <strong>County</strong> total to determ<strong>in</strong>e<br />
representation <strong>in</strong> PSA 1-C.<br />
Table 8. <strong>Senior</strong>s <strong>of</strong> Chaldean Ancestry <strong>in</strong> <strong>Wayne</strong> <strong>County</strong>, 2000<br />
Region Total 60+ 65+ 75+ 85+<br />
<strong>Michigan</strong> 34,408 3,269 2,256 684 166<br />
<strong>Wayne</strong> <strong>County</strong> 2,623 352 246 71 28<br />
% <strong>of</strong> State 7.6 10.8 10.9 10.4 16.9<br />
1-A 1,957 276 208 65 22<br />
1-C na na na na na<br />
Poverty Trends<br />
<strong>Wayne</strong> <strong>County</strong>’s share <strong>of</strong> the State’s elderly <strong>in</strong> poverty grew slightly between 1979 and<br />
1989, as the <strong>in</strong>crease <strong>in</strong> Region 1-C’s share, due to <strong>in</strong>creased population, outdistanced the<br />
decrease experienced <strong>in</strong> Region 1-A (Table 9). This trend reversed itself between 1989<br />
and 1999. While Region 1-C was <strong>in</strong>creas<strong>in</strong>g its overall share, <strong>in</strong> spite <strong>of</strong> a decrease <strong>in</strong> the<br />
total number <strong>of</strong> seniors, Region 1-A was los<strong>in</strong>g at a rate eight times that <strong>of</strong> the previous<br />
decade (the State share fell by 0.4 percentage po<strong>in</strong>ts between 1979 and 1989, as<br />
compared to 3.3 percentage po<strong>in</strong>ts between 1989 and 1999). . The overall result was a<br />
loss <strong>of</strong> 2.4 percentage po<strong>in</strong>ts <strong>in</strong> State share for the county from 30.9 percent to 28.5<br />
percent.<br />
Table 9. Share <strong>of</strong> State’s 60+ Population At or Below 100% <strong>of</strong> Poverty, 1979 – 1999 5<br />
Region 1979 1989 1999<br />
<strong>Wayne</strong> <strong>County</strong> 30.5 30.9 28.5<br />
1-A 24.1 23.7 20.4<br />
1-C 6.4 7.2 8.1<br />
5 Due to the fact that the Census Bureau did not use 60 years <strong>of</strong> age as a cut po<strong>in</strong>t for poverty calculations,<br />
the author produced estimates, the methodology <strong>of</strong> which is <strong>in</strong>cluded <strong>in</strong> regional reports.<br />
<strong>Demographic</strong> Summary for <strong>Wayne</strong> <strong>County</strong> 7


