

Demographic Profile of Senior in Wayne County, Michigan
Demographic Profile of Senior in Wayne County, Michigan
Demographic Profile of Senior in Wayne County, Michigan

Create successful ePaper yourself
Turn your PDF publications into a flip-book with our unique Google optimized e-Paper software.
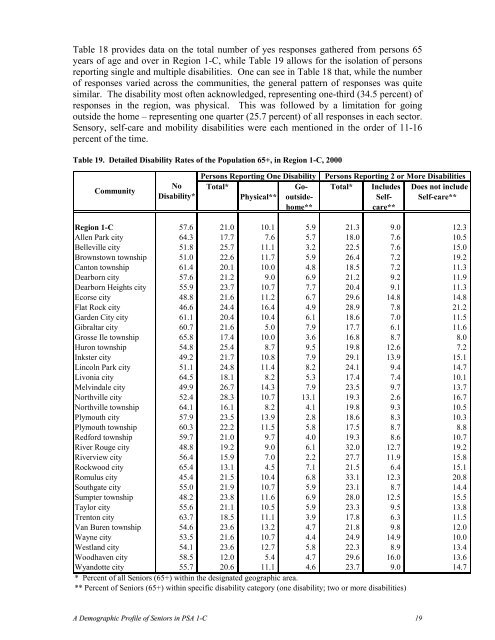
Table 18 provides data on the total number <strong>of</strong> yes responses gathered from persons 65<br />
years <strong>of</strong> age and over <strong>in</strong> Region 1-C, while Table 19 allows for the isolation <strong>of</strong> persons<br />
report<strong>in</strong>g s<strong>in</strong>gle and multiple disabilities. One can see <strong>in</strong> Table 18 that, while the number<br />
<strong>of</strong> responses varied across the communities, the general pattern <strong>of</strong> responses was quite<br />
similar. The disability most <strong>of</strong>ten acknowledged, represent<strong>in</strong>g one-third (34.5 percent) <strong>of</strong><br />
responses <strong>in</strong> the region, was physical. This was followed by a limitation for go<strong>in</strong>g<br />
outside the home – represent<strong>in</strong>g one quarter (25.7 percent) <strong>of</strong> all responses <strong>in</strong> each sector.<br />
Sensory, self-care and mobility disabilities were each mentioned <strong>in</strong> the order <strong>of</strong> 11-16<br />
percent <strong>of</strong> the time.<br />
Table 19. Detailed Disability Rates <strong>of</strong> the Population 65+, <strong>in</strong> Region 1-C, 2000<br />
Community<br />
No<br />
Disability*<br />
Persons Report<strong>in</strong>g One Disability<br />
Total*<br />
Go-<br />
Physical** outside-<br />
home**<br />
Persons Report<strong>in</strong>g 2 or More Disabilities<br />
Total* Includes<br />
Selfcare**<br />
Does not <strong>in</strong>clude<br />
Self-care**<br />
Region 1-C 57.6 21.0 10.1 5.9 21.3 9.0 12.3<br />
Allen Park city 64.3 17.7 7.6 5.7 18.0 7.6 10.5<br />
Belleville city 51.8 25.7 11.1 3.2 22.5 7.6 15.0<br />
Brownstown township 51.0 22.6 11.7 5.9 26.4 7.2 19.2<br />
Canton township 61.4 20.1 10.0 4.8 18.5 7.2 11.3<br />
Dearborn city 57.6 21.2 9.0 6.9 21.2 9.2 11.9<br />
Dearborn Heights city 55.9 23.7 10.7 7.7 20.4 9.1 11.3<br />
Ecorse city 48.8 21.6 11.2 6.7 29.6 14.8 14.8<br />
Flat Rock city 46.6 24.4 16.4 4.9 28.9 7.8 21.2<br />
Garden City city 61.1 20.4 10.4 6.1 18.6 7.0 11.5<br />
Gibraltar city 60.7 21.6 5.0 7.9 17.7 6.1 11.6<br />
Grosse Ile township 65.8 17.4 10.0 3.6 16.8 8.7 8.0<br />
Huron township 54.8 25.4 8.7 9.5 19.8 12.6 7.2<br />
Inkster city 49.2 21.7 10.8 7.9 29.1 13.9 15.1<br />
L<strong>in</strong>coln Park city 51.1 24.8 11.4 8.2 24.1 9.4 14.7<br />
Livonia city 64.5 18.1 8.2 5.3 17.4 7.4 10.1<br />
Melv<strong>in</strong>dale city 49.9 26.7 14.3 7.9 23.5 9.7 13.7<br />
Northville city 52.4 28.3 10.7 13.1 19.3 2.6 16.7<br />
Northville township 64.1 16.1 8.2 4.1 19.8 9.3 10.5<br />
Plymouth city 57.9 23.5 13.9 2.8 18.6 8.3 10.3<br />
Plymouth township 60.3 22.2 11.5 5.8 17.5 8.7 8.8<br />
Redford township 59.7 21.0 9.7 4.0 19.3 8.6 10.7<br />
River Rouge city 48.8 19.2 9.0 6.1 32.0 12.7 19.2<br />
Riverview city 56.4 15.9 7.0 2.2 27.7 11.9 15.8<br />
Rockwood city 65.4 13.1 4.5 7.1 21.5 6.4 15.1<br />
Romulus city 45.4 21.5 10.4 6.8 33.1 12.3 20.8<br />
Southgate city 55.0 21.9 10.7 5.9 23.1 8.7 14.4<br />
Sumpter township 48.2 23.8 11.6 6.9 28.0 12.5 15.5<br />
Taylor city 55.6 21.1 10.5 5.9 23.3 9.5 13.8<br />
Trenton city 63.7 18.5 11.1 3.9 17.8 6.3 11.5<br />
Van Buren township 54.6 23.6 13.2 4.7 21.8 9.8 12.0<br />
<strong>Wayne</strong> city 53.5 21.6 10.7 4.4 24.9 14.9 10.0<br />
Westland city 54.1 23.6 12.7 5.8 22.3 8.9 13.4<br />
Woodhaven city 58.5 12.0 5.4 4.7 29.6 16.0 13.6<br />
Wyandotte city 55.7 20.6 11.1 4.6 23.7 9.0 14.7<br />
* Percent <strong>of</strong> all <strong>Senior</strong>s (65+) with<strong>in</strong> the designated geographic area.<br />
** Percent <strong>of</strong> <strong>Senior</strong>s (65+) with<strong>in</strong> specific disability category (one disability; two or more disabilities)<br />
A <strong>Demographic</strong> <strong>Pr<strong>of</strong>ile</strong> <strong>of</strong> <strong>Senior</strong>s <strong>in</strong> PSA 1-C 19


