

Demographic Profile of Senior in Wayne County, Michigan
Demographic Profile of Senior in Wayne County, Michigan
Demographic Profile of Senior in Wayne County, Michigan

You also want an ePaper? Increase the reach of your titles
YUMPU automatically turns print PDFs into web optimized ePapers that Google loves.
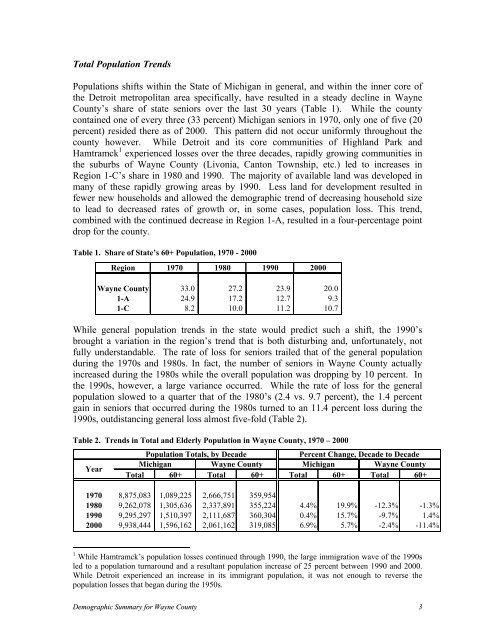
Total Population Trends<br />
Populations shifts with<strong>in</strong> the State <strong>of</strong> <strong>Michigan</strong> <strong>in</strong> general, and with<strong>in</strong> the <strong>in</strong>ner core <strong>of</strong><br />
the Detroit metropolitan area specifically, have resulted <strong>in</strong> a steady decl<strong>in</strong>e <strong>in</strong> <strong>Wayne</strong><br />
<strong>County</strong>’s share <strong>of</strong> state seniors over the last 30 years (Table 1). While the county<br />
conta<strong>in</strong>ed one <strong>of</strong> every three (33 percent) <strong>Michigan</strong> seniors <strong>in</strong> 1970, only one <strong>of</strong> five (20<br />
percent) resided there as <strong>of</strong> 2000. This pattern did not occur uniformly throughout the<br />
county however. While Detroit and its core communities <strong>of</strong> Highland Park and<br />
Hamtramck 1 experienced losses over the three decades, rapidly grow<strong>in</strong>g communities <strong>in</strong><br />
the suburbs <strong>of</strong> <strong>Wayne</strong> <strong>County</strong> (Livonia, Canton Township, etc.) led to <strong>in</strong>creases <strong>in</strong><br />
Region 1-C’s share <strong>in</strong> 1980 and 1990. The majority <strong>of</strong> available land was developed <strong>in</strong><br />
many <strong>of</strong> these rapidly grow<strong>in</strong>g areas by 1990. Less land for development resulted <strong>in</strong><br />
fewer new households and allowed the demographic trend <strong>of</strong> decreas<strong>in</strong>g household size<br />
to lead to decreased rates <strong>of</strong> growth or, <strong>in</strong> some cases, population loss. This trend,<br />
comb<strong>in</strong>ed with the cont<strong>in</strong>ued decrease <strong>in</strong> Region 1-A, resulted <strong>in</strong> a four-percentage po<strong>in</strong>t<br />
drop for the county.<br />
Table 1. Share <strong>of</strong> State’s 60+ Population, 1970 - 2000<br />
While general population trends <strong>in</strong> the state would predict such a shift, the 1990’s<br />
brought a variation <strong>in</strong> the region’s trend that is both disturb<strong>in</strong>g and, unfortunately, not<br />
fully understandable. The rate <strong>of</strong> loss for seniors trailed that <strong>of</strong> the general population<br />
dur<strong>in</strong>g the 1970s and 1980s. In fact, the number <strong>of</strong> seniors <strong>in</strong> <strong>Wayne</strong> <strong>County</strong> actually<br />
<strong>in</strong>creased dur<strong>in</strong>g the 1980s while the overall population was dropp<strong>in</strong>g by 10 percent. In<br />
the 1990s, however, a large variance occurred. While the rate <strong>of</strong> loss for the general<br />
population slowed to a quarter that <strong>of</strong> the 1980’s (2.4 vs. 9.7 percent), the 1.4 percent<br />
ga<strong>in</strong> <strong>in</strong> seniors that occurred dur<strong>in</strong>g the 1980s turned to an 11.4 percent loss dur<strong>in</strong>g the<br />
1990s, outdistanc<strong>in</strong>g general loss almost five-fold (Table 2).<br />
Table 2. Trends <strong>in</strong> Total and Elderly Population <strong>in</strong> <strong>Wayne</strong> <strong>County</strong>, 1970 – 2000<br />
Year<br />
Region 1970 1980 1990 2000<br />
<strong>Wayne</strong> <strong>County</strong> 33.0 27.2 23.9 20.0<br />
1-A 24.9 17.2 12.7 9.3<br />
1-C 8.2 10.0 11.2 10.7<br />
Population Totals, by Decade<br />
Percent Change, Decade to Decade<br />
<strong>Michigan</strong> <strong>Wayne</strong> <strong>County</strong> <strong>Michigan</strong> <strong>Wayne</strong> <strong>County</strong><br />
Total 60+ Total 60+ Total 60+ Total 60+<br />
1970 8,875,083 1,089,225 2,666,751 359,954<br />
1980 9,262,078 1,305,636 2,337,891 355,224 4.4% 19.9% -12.3% -1.3%<br />
1990 9,295,297 1,510,397 2,111,687 360,304 0.4% 15.7% -9.7% 1.4%<br />
2000 9,938,444 1,596,162 2,061,162 319,085 6.9% 5.7% -2.4% -11.4%<br />
1 While Hamtramck’s population losses cont<strong>in</strong>ued through 1990, the large immigration wave <strong>of</strong> the 1990s<br />
led to a population turnaround and a resultant population <strong>in</strong>crease <strong>of</strong> 25 percent between 1990 and 2000.<br />
While Detroit experienced an <strong>in</strong>crease <strong>in</strong> its immigrant population, it was not enough to reverse the<br />
population losses that began dur<strong>in</strong>g the 1950s.<br />
<strong>Demographic</strong> Summary for <strong>Wayne</strong> <strong>County</strong> 3


