

Demographic Profile of Senior in Wayne County, Michigan
Demographic Profile of Senior in Wayne County, Michigan
Demographic Profile of Senior in Wayne County, Michigan

Create successful ePaper yourself
Turn your PDF publications into a flip-book with our unique Google optimized e-Paper software.
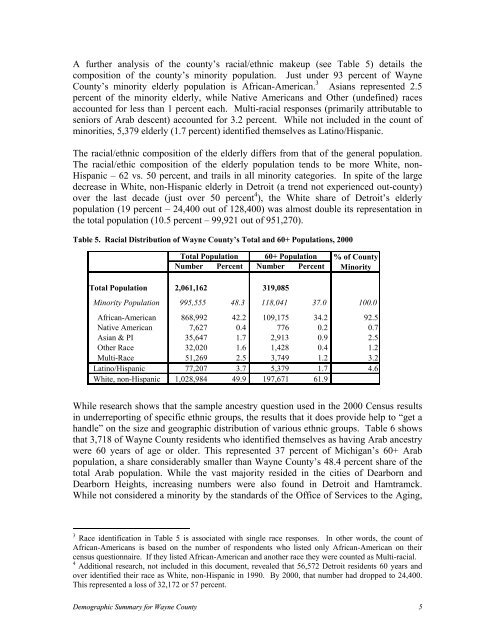
A further analysis <strong>of</strong> the county’s racial/ethnic makeup (see Table 5) details the<br />
composition <strong>of</strong> the county’s m<strong>in</strong>ority population. Just under 93 percent <strong>of</strong> <strong>Wayne</strong><br />
<strong>County</strong>’s m<strong>in</strong>ority elderly population is African-American. 3 Asians represented 2.5<br />
percent <strong>of</strong> the m<strong>in</strong>ority elderly, while Native Americans and Other (undef<strong>in</strong>ed) races<br />
accounted for less than 1 percent each. Multi-racial responses (primarily attributable to<br />
seniors <strong>of</strong> Arab descent) accounted for 3.2 percent. While not <strong>in</strong>cluded <strong>in</strong> the count <strong>of</strong><br />
m<strong>in</strong>orities, 5,379 elderly (1.7 percent) identified themselves as Lat<strong>in</strong>o/Hispanic.<br />
The racial/ethnic composition <strong>of</strong> the elderly differs from that <strong>of</strong> the general population.<br />
The racial/ethic composition <strong>of</strong> the elderly population tends to be more White, non-<br />
Hispanic – 62 vs. 50 percent, and trails <strong>in</strong> all m<strong>in</strong>ority categories. In spite <strong>of</strong> the large<br />
decrease <strong>in</strong> White, non-Hispanic elderly <strong>in</strong> Detroit (a trend not experienced out-county)<br />
over the last decade (just over 50 percent 4 ), the White share <strong>of</strong> Detroit’s elderly<br />
population (19 percent – 24,400 out <strong>of</strong> 128,400) was almost double its representation <strong>in</strong><br />
the total population (10.5 percent – 99,921 out <strong>of</strong> 951,270).<br />
Table 5. Racial Distribution <strong>of</strong> <strong>Wayne</strong> <strong>County</strong>’s Total and 60+ Populations, 2000<br />
Total Population 60+ Population % <strong>of</strong> <strong>County</strong><br />
Number Percent Number Percent M<strong>in</strong>ority<br />
Total Population 2,061,162 319,085<br />
M<strong>in</strong>ority Population 995,555 48.3 118,041 37.0 100.0<br />
African-American 868,992 42.2 109,175 34.2 92.5<br />
Native American 7,627 0.4 776 0.2 0.7<br />
Asian & PI 35,647 1.7 2,913 0.9 2.5<br />
Other Race 32,020 1.6 1,428 0.4 1.2<br />
Multi-Race 51,269 2.5 3,749 1.2 3.2<br />
Lat<strong>in</strong>o/Hispanic 77,207 3.7 5,379 1.7 4.6<br />
White, non-Hispanic 1,028,984 49.9 197,671 61.9<br />
While research shows that the sample ancestry question used <strong>in</strong> the 2000 Census results<br />
<strong>in</strong> underreport<strong>in</strong>g <strong>of</strong> specific ethnic groups, the results that it does provide help to “get a<br />
handle” on the size and geographic distribution <strong>of</strong> various ethnic groups. Table 6 shows<br />
that 3,718 <strong>of</strong> <strong>Wayne</strong> <strong>County</strong> residents who identified themselves as hav<strong>in</strong>g Arab ancestry<br />
were 60 years <strong>of</strong> age or older. This represented 37 percent <strong>of</strong> <strong>Michigan</strong>’s 60+ Arab<br />
population, a share considerably smaller than <strong>Wayne</strong> <strong>County</strong>’s 48.4 percent share <strong>of</strong> the<br />
total Arab population. While the vast majority resided <strong>in</strong> the cities <strong>of</strong> Dearborn and<br />
Dearborn Heights, <strong>in</strong>creas<strong>in</strong>g numbers were also found <strong>in</strong> Detroit and Hamtramck.<br />
While not considered a m<strong>in</strong>ority by the standards <strong>of</strong> the Office <strong>of</strong> Services to the Ag<strong>in</strong>g,<br />
3 Race identification <strong>in</strong> Table 5 is associated with s<strong>in</strong>gle race responses. In other words, the count <strong>of</strong><br />
African-Americans is based on the number <strong>of</strong> respondents who listed only African-American on their<br />
census questionnaire. If they listed African-American and another race they were counted as Multi-racial.<br />
4 Additional research, not <strong>in</strong>cluded <strong>in</strong> this document, revealed that 56,572 Detroit residents 60 years and<br />
over identified their race as White, non-Hispanic <strong>in</strong> 1990. By 2000, that number had dropped to 24,400.<br />
This represented a loss <strong>of</strong> 32,172 or 57 percent.<br />
<strong>Demographic</strong> Summary for <strong>Wayne</strong> <strong>County</strong> 5


