

Demographic Profile of Senior in Wayne County, Michigan
Demographic Profile of Senior in Wayne County, Michigan
Demographic Profile of Senior in Wayne County, Michigan

Create successful ePaper yourself
Turn your PDF publications into a flip-book with our unique Google optimized e-Paper software.
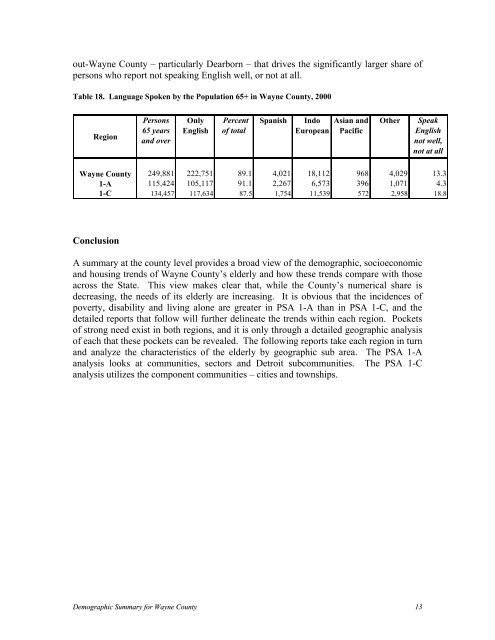
out-<strong>Wayne</strong> <strong>County</strong> – particularly Dearborn – that drives the significantly larger share <strong>of</strong><br />
persons who report not speak<strong>in</strong>g English well, or not at all.<br />
Table 18. Language Spoken by the Population 65+ <strong>in</strong> <strong>Wayne</strong> <strong>County</strong>, 2000<br />
Region<br />
Persons<br />
65 years<br />
and over<br />
Only<br />
English<br />
Percent<br />
<strong>of</strong> total<br />
Spanish<br />
Indo<br />
European<br />
Asian and<br />
Pacific<br />
Other<br />
Speak<br />
English<br />
not well,<br />
not at all<br />
<strong>Wayne</strong> <strong>County</strong> 249,881 222,751 89.1 4,021 18,112 968 4,029 13.3<br />
1-A 115,424 105,117 91.1 2,267 6,573 396 1,071 4.3<br />
1-C 134,457 117,634 87.5 1,754 11,539 572 2,958 18.8<br />
Conclusion<br />
A summary at the county level provides a broad view <strong>of</strong> the demographic, socioeconomic<br />
and hous<strong>in</strong>g trends <strong>of</strong> <strong>Wayne</strong> <strong>County</strong>’s elderly and how these trends compare with those<br />
across the State. This view makes clear that, while the <strong>County</strong>’s numerical share is<br />
decreas<strong>in</strong>g, the needs <strong>of</strong> its elderly are <strong>in</strong>creas<strong>in</strong>g. It is obvious that the <strong>in</strong>cidences <strong>of</strong><br />
poverty, disability and liv<strong>in</strong>g alone are greater <strong>in</strong> PSA 1-A than <strong>in</strong> PSA 1-C, and the<br />
detailed reports that follow will further del<strong>in</strong>eate the trends with<strong>in</strong> each region. Pockets<br />
<strong>of</strong> strong need exist <strong>in</strong> both regions, and it is only through a detailed geographic analysis<br />
<strong>of</strong> each that these pockets can be revealed. The follow<strong>in</strong>g reports take each region <strong>in</strong> turn<br />
and analyze the characteristics <strong>of</strong> the elderly by geographic sub area. The PSA 1-A<br />
analysis looks at communities, sectors and Detroit subcommunities. The PSA 1-C<br />
analysis utilizes the component communities – cities and townships.<br />
<strong>Demographic</strong> Summary for <strong>Wayne</strong> <strong>County</strong> 13


