

Demographic Profile of Senior in Wayne County, Michigan
Demographic Profile of Senior in Wayne County, Michigan
Demographic Profile of Senior in Wayne County, Michigan

Create successful ePaper yourself
Turn your PDF publications into a flip-book with our unique Google optimized e-Paper software.
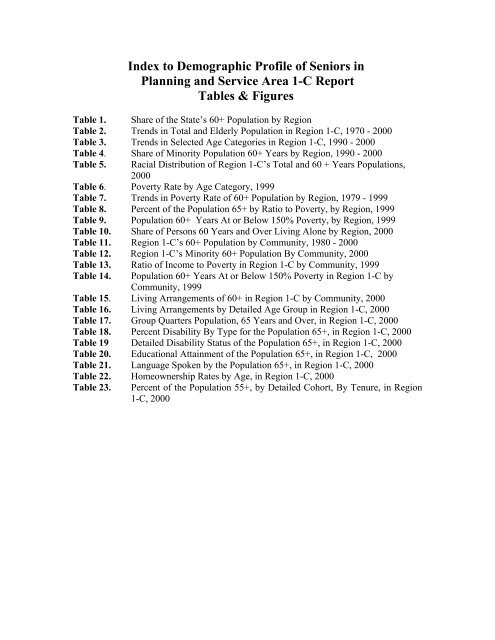
Index to <strong>Demographic</strong> <strong>Pr<strong>of</strong>ile</strong> <strong>of</strong> <strong>Senior</strong>s <strong>in</strong><br />
Plann<strong>in</strong>g and Service Area 1-C Report<br />
Tables & Figures<br />
Table 1. Share <strong>of</strong> the State’s 60+ Population by Region<br />
Table 2. Trends <strong>in</strong> Total and Elderly Population <strong>in</strong> Region 1-C, 1970 - 2000<br />
Table 3. Trends <strong>in</strong> Selected Age Categories <strong>in</strong> Region 1-C, 1990 - 2000<br />
Table 4. Share <strong>of</strong> M<strong>in</strong>ority Population 60+ Years by Region, 1990 - 2000<br />
Table 5. Racial Distribution <strong>of</strong> Region 1-C’s Total and 60 + Years Populations,<br />
2000<br />
Table 6. Poverty Rate by Age Category, 1999<br />
Table 7. Trends <strong>in</strong> Poverty Rate <strong>of</strong> 60+ Population by Region, 1979 - 1999<br />
Table 8. Percent <strong>of</strong> the Population 65+ by Ratio to Poverty, by Region, 1999<br />
Table 9. Population 60+ Years At or Below 150% Poverty, by Region, 1999<br />
Table 10. Share <strong>of</strong> Persons 60 Years and Over Liv<strong>in</strong>g Alone by Region, 2000<br />
Table 11. Region 1-C’s 60+ Population by Community, 1980 - 2000<br />
Table 12. Region 1-C’s M<strong>in</strong>ority 60+ Population By Community, 2000<br />
Table 13. Ratio <strong>of</strong> Income to Poverty <strong>in</strong> Region 1-C by Community, 1999<br />
Table 14. Population 60+ Years At or Below 150% Poverty <strong>in</strong> Region 1-C by<br />
Community, 1999<br />
Table 15. Liv<strong>in</strong>g Arrangements <strong>of</strong> 60+ <strong>in</strong> Region 1-C by Community, 2000<br />
Table 16. Liv<strong>in</strong>g Arrangements by Detailed Age Group <strong>in</strong> Region 1-C, 2000<br />
Table 17. Group Quarters Population, 65 Years and Over, <strong>in</strong> Region 1-C, 2000<br />
Table 18. Percent Disability By Type for the Population 65+, <strong>in</strong> Region 1-C, 2000<br />
Table 19 Detailed Disability Status <strong>of</strong> the Population 65+, <strong>in</strong> Region 1-C, 2000<br />
Table 20. Educational Atta<strong>in</strong>ment <strong>of</strong> the Population 65+, <strong>in</strong> Region 1-C, 2000<br />
Table 21. Language Spoken by the Population 65+, <strong>in</strong> Region 1-C, 2000<br />
Table 22. Homeownership Rates by Age, <strong>in</strong> Region 1-C, 2000<br />
Table 23.<br />
Percent <strong>of</strong> the Population 55+, by Detailed Cohort, By Tenure, <strong>in</strong> Region<br />
1-C, 2000


