

Demographic Profile of Senior in Wayne County, Michigan
Demographic Profile of Senior in Wayne County, Michigan
Demographic Profile of Senior in Wayne County, Michigan

You also want an ePaper? Increase the reach of your titles
YUMPU automatically turns print PDFs into web optimized ePapers that Google loves.
While the <strong>Michigan</strong> Office <strong>of</strong> Services to the Ag<strong>in</strong>g utilizes, as their poverty component,<br />
persons 60 years and over below 150% <strong>of</strong> poverty, the standard tabulations for the 2000<br />
Census, unlike previous censuses, did not provide for such a tabulation. Rather, the data<br />
tables as produced only allowed calculations to be made for persons 55 years and over or<br />
65 years and over. <strong>Michigan</strong> was forced to request, and pay for, a special tabulation. 6<br />
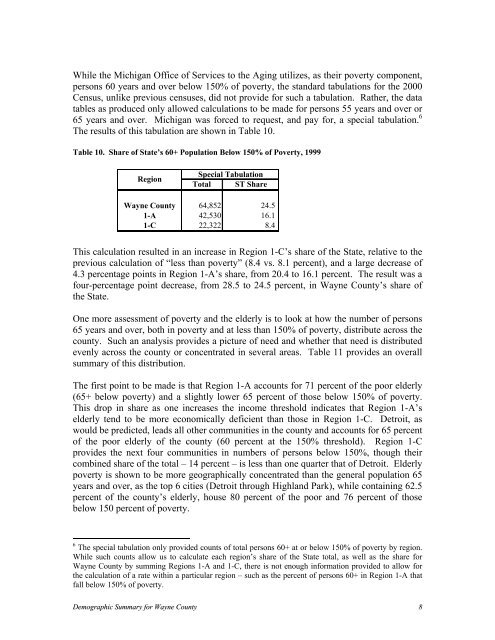
The results <strong>of</strong> this tabulation are shown <strong>in</strong> Table 10.<br />
Table 10. Share <strong>of</strong> State’s 60+ Population Below 150% <strong>of</strong> Poverty, 1999<br />
Region<br />
Special Tabulation<br />
Total ST Share<br />
<strong>Wayne</strong> <strong>County</strong> 64,852 24.5<br />
1-A 42,530 16.1<br />
1-C 22,322 8.4<br />
This calculation resulted <strong>in</strong> an <strong>in</strong>crease <strong>in</strong> Region 1-C’s share <strong>of</strong> the State, relative to the<br />
previous calculation <strong>of</strong> “less than poverty” (8.4 vs. 8.1 percent), and a large decrease <strong>of</strong><br />
4.3 percentage po<strong>in</strong>ts <strong>in</strong> Region 1-A’s share, from 20.4 to 16.1 percent. The result was a<br />
four-percentage po<strong>in</strong>t decrease, from 28.5 to 24.5 percent, <strong>in</strong> <strong>Wayne</strong> <strong>County</strong>’s share <strong>of</strong><br />
the State.<br />
One more assessment <strong>of</strong> poverty and the elderly is to look at how the number <strong>of</strong> persons<br />
65 years and over, both <strong>in</strong> poverty and at less than 150% <strong>of</strong> poverty, distribute across the<br />
county. Such an analysis provides a picture <strong>of</strong> need and whether that need is distributed<br />
evenly across the county or concentrated <strong>in</strong> several areas. Table 11 provides an overall<br />
summary <strong>of</strong> this distribution.<br />
The first po<strong>in</strong>t to be made is that Region 1-A accounts for 71 percent <strong>of</strong> the poor elderly<br />
(65+ below poverty) and a slightly lower 65 percent <strong>of</strong> those below 150% <strong>of</strong> poverty.<br />
This drop <strong>in</strong> share as one <strong>in</strong>creases the <strong>in</strong>come threshold <strong>in</strong>dicates that Region 1-A’s<br />
elderly tend to be more economically deficient than those <strong>in</strong> Region 1-C. Detroit, as<br />
would be predicted, leads all other communities <strong>in</strong> the county and accounts for 65 percent<br />
<strong>of</strong> the poor elderly <strong>of</strong> the county (60 percent at the 150% threshold). Region 1-C<br />
provides the next four communities <strong>in</strong> numbers <strong>of</strong> persons below 150%, though their<br />
comb<strong>in</strong>ed share <strong>of</strong> the total – 14 percent – is less than one quarter that <strong>of</strong> Detroit. Elderly<br />
poverty is shown to be more geographically concentrated than the general population 65<br />
years and over, as the top 6 cities (Detroit through Highland Park), while conta<strong>in</strong><strong>in</strong>g 62.5<br />
percent <strong>of</strong> the county’s elderly, house 80 percent <strong>of</strong> the poor and 76 percent <strong>of</strong> those<br />
below 150 percent <strong>of</strong> poverty.<br />
6 The special tabulation only provided counts <strong>of</strong> total persons 60+ at or below 150% <strong>of</strong> poverty by region.<br />
While such counts allow us to calculate each region’s share <strong>of</strong> the State total, as well as the share for<br />
<strong>Wayne</strong> <strong>County</strong> by summ<strong>in</strong>g Regions 1-A and 1-C, there is not enough <strong>in</strong>formation provided to allow for<br />
the calculation <strong>of</strong> a rate with<strong>in</strong> a particular region – such as the percent <strong>of</strong> persons 60+ <strong>in</strong> Region 1-A that<br />
fall below 150% <strong>of</strong> poverty.<br />
<strong>Demographic</strong> Summary for <strong>Wayne</strong> <strong>County</strong> 8


