

Demographic Profile of Senior in Wayne County, Michigan
Demographic Profile of Senior in Wayne County, Michigan
Demographic Profile of Senior in Wayne County, Michigan

You also want an ePaper? Increase the reach of your titles
YUMPU automatically turns print PDFs into web optimized ePapers that Google loves.
egions, across all age groups. Only one region (1B) had a lower poverty rate, and one (6)<br />
the same, <strong>in</strong> the 55-64 year cohort. Region 1-C had the lowest rate <strong>of</strong> any region for all<br />
persons 65 years <strong>of</strong> age and over. Look<strong>in</strong>g further at this age group’s component cohorts,<br />
we see that Region 1-C was surpassed by four regions (1-B, 6, 10 and 14) <strong>in</strong> the 65-74<br />
year cohort, and only one (3A) for persons 75 years and over. Due to 2000 Census<br />
tabulation issues, the only way to approximate the tabulation for 60+ is to perform an<br />
allocation based on population share. 4 Utiliz<strong>in</strong>g this estimation method we f<strong>in</strong>d that the<br />
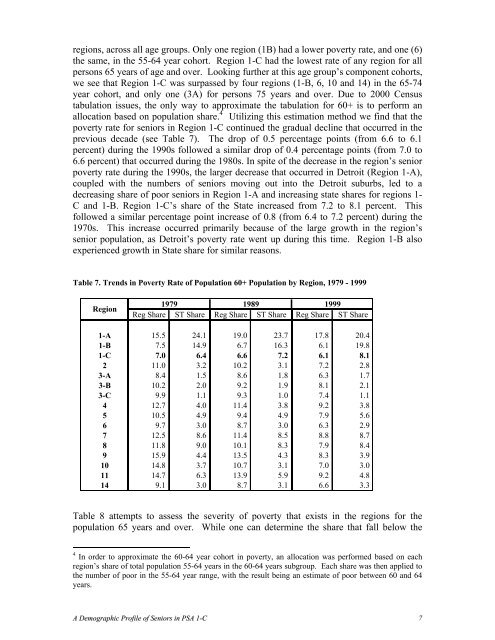
poverty rate for seniors <strong>in</strong> Region 1-C cont<strong>in</strong>ued the gradual decl<strong>in</strong>e that occurred <strong>in</strong> the<br />
previous decade (see Table 7). The drop <strong>of</strong> 0.5 percentage po<strong>in</strong>ts (from 6.6 to 6.1<br />
percent) dur<strong>in</strong>g the 1990s followed a similar drop <strong>of</strong> 0.4 percentage po<strong>in</strong>ts (from 7.0 to<br />
6.6 percent) that occurred dur<strong>in</strong>g the 1980s. In spite <strong>of</strong> the decrease <strong>in</strong> the region’s senior<br />
poverty rate dur<strong>in</strong>g the 1990s, the larger decrease that occurred <strong>in</strong> Detroit (Region 1-A),<br />
coupled with the numbers <strong>of</strong> seniors mov<strong>in</strong>g out <strong>in</strong>to the Detroit suburbs, led to a<br />
decreas<strong>in</strong>g share <strong>of</strong> poor seniors <strong>in</strong> Region 1-A and <strong>in</strong>creas<strong>in</strong>g state shares for regions 1-<br />
C and 1-B. Region 1-C’s share <strong>of</strong> the State <strong>in</strong>creased from 7.2 to 8.1 percent. This<br />
followed a similar percentage po<strong>in</strong>t <strong>in</strong>crease <strong>of</strong> 0.8 (from 6.4 to 7.2 percent) dur<strong>in</strong>g the<br />
1970s. This <strong>in</strong>crease occurred primarily because <strong>of</strong> the large growth <strong>in</strong> the region’s<br />
senior population, as Detroit’s poverty rate went up dur<strong>in</strong>g this time. Region 1-B also<br />
experienced growth <strong>in</strong> State share for similar reasons.<br />
Table 7. Trends <strong>in</strong> Poverty Rate <strong>of</strong> Population 60+ Population by Region, 1979 - 1999<br />
Region<br />
1979 1989<br />
1999<br />
Reg Share ST Share Reg Share ST Share Reg Share ST Share<br />
1-A 15.5 24.1 19.0 23.7 17.8 20.4<br />
1-B 7.5 14.9 6.7 16.3 6.1 19.8<br />
1-C 7.0 6.4 6.6 7.2 6.1 8.1<br />
2 11.0 3.2 10.2 3.1 7.2 2.8<br />
3-A 8.4 1.5 8.6 1.8 6.3 1.7<br />
3-B 10.2 2.0 9.2 1.9 8.1 2.1<br />
3-C 9.9 1.1 9.3 1.0 7.4 1.1<br />
4 12.7 4.0 11.4 3.8 9.2 3.8<br />
5 10.5 4.9 9.4 4.9 7.9 5.6<br />
6 9.7 3.0 8.7 3.0 6.3 2.9<br />
7 12.5 8.6 11.4 8.5 8.8 8.7<br />
8 11.8 9.0 10.1 8.3 7.9 8.4<br />
9 15.9 4.4 13.5 4.3 8.3 3.9<br />
10 14.8 3.7 10.7 3.1 7.0 3.0<br />
11 14.7 6.3 13.9 5.9 9.2 4.8<br />
14 9.1 3.0 8.7 3.1 6.6 3.3<br />
Table 8 attempts to assess the severity <strong>of</strong> poverty that exists <strong>in</strong> the regions for the<br />
population 65 years and over. While one can determ<strong>in</strong>e the share that fall below the<br />
4 In order to approximate the 60-64 year cohort <strong>in</strong> poverty, an allocation was performed based on each<br />
region’s share <strong>of</strong> total population 55-64 years <strong>in</strong> the 60-64 years subgroup. Each share was then applied to<br />
the number <strong>of</strong> poor <strong>in</strong> the 55-64 year range, with the result be<strong>in</strong>g an estimate <strong>of</strong> poor between 60 and 64<br />
years.<br />
A <strong>Demographic</strong> <strong>Pr<strong>of</strong>ile</strong> <strong>of</strong> <strong>Senior</strong>s <strong>in</strong> PSA 1-C 7


