

Demographic Profile of Senior in Wayne County, Michigan
Demographic Profile of Senior in Wayne County, Michigan
Demographic Profile of Senior in Wayne County, Michigan

Create successful ePaper yourself
Turn your PDF publications into a flip-book with our unique Google optimized e-Paper software.
In addition to the factors summarized above, the three reports also delved <strong>in</strong>to other<br />
variables that could be used to document need for service. Among these factors were<br />
liv<strong>in</strong>g arrangements, specifically seniors liv<strong>in</strong>g alone, disability status, with concentration<br />
on multiple disabilities, educational atta<strong>in</strong>ment and language spoken.<br />
The condition <strong>of</strong> liv<strong>in</strong>g alone <strong>of</strong>ten removes a senior from social networks and other<br />
service access. This is particularly true <strong>in</strong> poorer urban areas such as Detroit and selected<br />
<strong>Wayne</strong> <strong>County</strong> communities. On the whole, the liv<strong>in</strong>g arrangements <strong>of</strong> <strong>Wayne</strong> <strong>County</strong><br />
seniors closely mirrored those <strong>of</strong> the State. In terms <strong>of</strong> all seniors 60 years and over, a<br />
slightly higher share <strong>of</strong> the county’s seniors lived alone and represented almost 22<br />
percent <strong>of</strong> the State’s total (slightly higher than its share <strong>of</strong> the population 60 and over).<br />
Liv<strong>in</strong>g arrangements for the subset <strong>of</strong> 65 years and over showed the county’s seniors<br />
mirror<strong>in</strong>g those across the state, but also showed a divergence with<strong>in</strong> the county. By the<br />
age <strong>of</strong> 75 years and over, the county’s rate <strong>of</strong> liv<strong>in</strong>g alone drops below that <strong>of</strong> the State.<br />
The split with<strong>in</strong> the county widens as PSA 1-A’s seniors live alone at a rate well below<br />
that <strong>of</strong> the State, while PSA 1-C’s seniors’ rate essentially mirrors that <strong>of</strong> the State.<br />
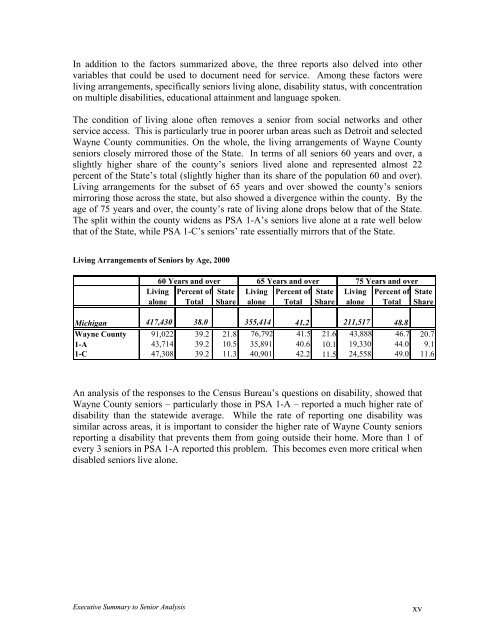
Liv<strong>in</strong>g Arrangements <strong>of</strong> <strong>Senior</strong>s by Age, 2000<br />
60 Years and over 65 Years and over 75 Years and over<br />
Percent <strong>of</strong> State Liv<strong>in</strong>g Percent <strong>of</strong> State Liv<strong>in</strong>g Percent <strong>of</strong><br />
Total Share alone Total Share alone Total<br />
Liv<strong>in</strong>g<br />
alone<br />
State<br />
Share<br />
<strong>Michigan</strong> 417,430 38.0 355,414 41.2 211,517 48.8<br />
<strong>Wayne</strong> <strong>County</strong> 91,022 39.2 21.8 76,792 41.5 21.6 43,888 46.7 20.7<br />
1-A 43,714 39.2 10.5 35,891 40.6 10.1 19,330 44.0 9.1<br />
1-C 47,308 39.2 11.3 40,901 42.2 11.5 24,558 49.0 11.6<br />
An analysis <strong>of</strong> the responses to the Census Bureau’s questions on disability, showed that<br />
<strong>Wayne</strong> <strong>County</strong> seniors – particularly those <strong>in</strong> PSA 1-A – reported a much higher rate <strong>of</strong><br />
disability than the statewide average. While the rate <strong>of</strong> report<strong>in</strong>g one disability was<br />
similar across areas, it is important to consider the higher rate <strong>of</strong> <strong>Wayne</strong> <strong>County</strong> seniors<br />
report<strong>in</strong>g a disability that prevents them from go<strong>in</strong>g outside their home. More than 1 <strong>of</strong><br />
every 3 seniors <strong>in</strong> PSA 1-A reported this problem. This becomes even more critical when<br />
disabled seniors live alone.<br />
Executive Summary to <strong>Senior</strong> Analysis<br />
xv


