

Demographic Profile of Senior in Wayne County, Michigan
Demographic Profile of Senior in Wayne County, Michigan
Demographic Profile of Senior in Wayne County, Michigan

Create successful ePaper yourself
Turn your PDF publications into a flip-book with our unique Google optimized e-Paper software.
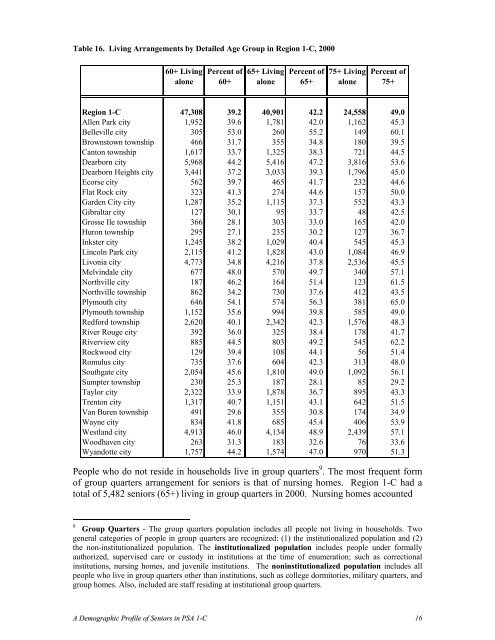
Table 16. Liv<strong>in</strong>g Arrangements by Detailed Age Group <strong>in</strong> Region 1-C, 2000<br />
60+ Liv<strong>in</strong>g<br />
alone<br />
Percent <strong>of</strong><br />
60+<br />
65+ Liv<strong>in</strong>g<br />
alone<br />
Percent <strong>of</strong><br />
65+<br />
75+ Liv<strong>in</strong>g<br />
alone<br />
Percent <strong>of</strong><br />
75+<br />
Region 1-C 47,308 39.2 40,901 42.2 24,558 49.0<br />
Allen Park city 1,952 39.6 1,781 42.0 1,162 45.3<br />
Belleville city 305 53.0 260 55.2 149 60.1<br />
Brownstown township 466 31.7 355 34.8 180 39.5<br />
Canton township 1,617 33.7 1,325 38.3 721 44.5<br />
Dearborn city 5,968 44.2 5,416 47.2 3,816 53.6<br />
Dearborn Heights city 3,441 37.2 3,033 39.3 1,796 45.0<br />
Ecorse city 562 39.7 465 41.7 232 44.6<br />
Flat Rock city 323 41.3 274 44.6 157 50.0<br />
Garden City city 1,287 35.2 1,115 37.3 552 43.3<br />
Gibraltar city 127 30.1 95 33.7 48 42.5<br />
Grosse Ile township 366 28.1 303 33.0 165 42.0<br />
Huron township 295 27.1 235 30.2 127 36.7<br />
Inkster city 1,245 38.2 1,029 40.4 545 45.3<br />
L<strong>in</strong>coln Park city 2,115 41.2 1,828 43.0 1,084 46.9<br />
Livonia city 4,773 34.8 4,216 37.8 2,536 45.5<br />
Melv<strong>in</strong>dale city 677 48.0 570 49.7 340 57.1<br />
Northville city 187 46.2 164 51.4 123 61.5<br />
Northville township 862 34.2 730 37.6 412 43.5<br />
Plymouth city 646 54.1 574 56.3 381 65.0<br />
Plymouth township 1,152 35.6 994 39.8 585 49.0<br />
Redford township 2,620 40.1 2,342 42.3 1,576 48.3<br />
River Rouge city 392 36.0 325 38.4 178 41.7<br />
Riverview city 885 44.5 803 49.2 545 62.2<br />
Rockwood city 129 39.4 108 44.1 56 51.4<br />
Romulus city 735 37.6 604 42.3 313 48.0<br />
Southgate city 2,054 45.6 1,810 49.0 1,092 56.1<br />
Sumpter township 230 25.3 187 28.1 85 29.2<br />
Taylor city 2,322 33.9 1,878 36.7 895 43.3<br />
Trenton city 1,317 40.7 1,151 43.1 642 51.5<br />
Van Buren township 491 29.6 355 30.8 174 34.9<br />
<strong>Wayne</strong> city 834 41.8 685 45.4 406 53.9<br />
Westland city 4,913 46.0 4,134 48.9 2,439 57.1<br />
Woodhaven city 263 31.3 183 32.6 76 33.6<br />
Wyandotte city 1,757 44.2 1,574 47.0 970 51.3<br />
People who do not reside <strong>in</strong> households live <strong>in</strong> group quarters 9 . The most frequent form<br />
<strong>of</strong> group quarters arrangement for seniors is that <strong>of</strong> nurs<strong>in</strong>g homes. Region 1-C had a<br />
total <strong>of</strong> 5,482 seniors (65+) liv<strong>in</strong>g <strong>in</strong> group quarters <strong>in</strong> 2000. Nurs<strong>in</strong>g homes accounted<br />
9<br />
Group Quarters - The group quarters population <strong>in</strong>cludes all people not liv<strong>in</strong>g <strong>in</strong> households. Two<br />
general categories <strong>of</strong> people <strong>in</strong> group quarters are recognized: (1) the <strong>in</strong>stitutionalized population and (2)<br />
the non-<strong>in</strong>stitutionalized population. The <strong>in</strong>stitutionalized population <strong>in</strong>cludes people under formally<br />
authorized, supervised care or custody <strong>in</strong> <strong>in</strong>stitutions at the time <strong>of</strong> enumeration; such as correctional<br />
<strong>in</strong>stitutions, nurs<strong>in</strong>g homes, and juvenile <strong>in</strong>stitutions. The non<strong>in</strong>stitutionalized population <strong>in</strong>cludes all<br />
people who live <strong>in</strong> group quarters other than <strong>in</strong>stitutions, such as college dormitories, military quarters, and<br />
group homes. Also, <strong>in</strong>cluded are staff resid<strong>in</strong>g at <strong>in</strong>stitutional group quarters.<br />
A <strong>Demographic</strong> <strong>Pr<strong>of</strong>ile</strong> <strong>of</strong> <strong>Senior</strong>s <strong>in</strong> PSA 1-C 16


