

Demographic Profile of Senior in Wayne County, Michigan
Demographic Profile of Senior in Wayne County, Michigan
Demographic Profile of Senior in Wayne County, Michigan

Create successful ePaper yourself
Turn your PDF publications into a flip-book with our unique Google optimized e-Paper software.
A <strong>Demographic</strong> <strong>Pr<strong>of</strong>ile</strong> <strong>of</strong> <strong>Senior</strong>s <strong>in</strong> PSA 1-A:<br />
Implications for Fund<strong>in</strong>g and Service Delivery<br />
The Detroit Area Agency on Ag<strong>in</strong>g Region 1-A is comprised <strong>of</strong> the follow<strong>in</strong>g cities:<br />
Detroit, the five Grosse Po<strong>in</strong>tes, Hamtramck, Harper Woods, and Highland Park. In<br />
order to analyze the agency’s population base (persons 60 years and over), both with<br />
regard to current residential distribution and trends over time, we have utilized several<br />
different geographic structures.<br />
Total Population Trends<br />
At the State level we have analyzed Region 1-A <strong>in</strong> relation to the other 15 regions <strong>in</strong> the<br />
State. The primary variables that will be exam<strong>in</strong>ed <strong>in</strong> this analysis are: share <strong>of</strong> State’s<br />
population 60 years and over; share <strong>of</strong> State’s m<strong>in</strong>ority population 60 years and over;<br />
share <strong>of</strong> State’s population 60 years and over <strong>in</strong> poverty. An additional set <strong>of</strong> variables,<br />
judged as relevant measures <strong>of</strong> the health and well-be<strong>in</strong>g <strong>of</strong> seniors, will also be<br />
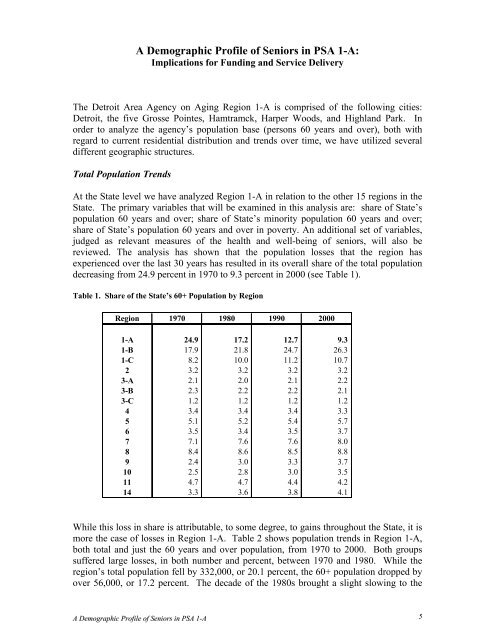
reviewed. The analysis has shown that the population losses that the region has<br />
experienced over the last 30 years has resulted <strong>in</strong> its overall share <strong>of</strong> the total population<br />
decreas<strong>in</strong>g from 24.9 percent <strong>in</strong> 1970 to 9.3 percent <strong>in</strong> 2000 (see Table 1).<br />
Table 1. Share <strong>of</strong> the State’s 60+ Population by Region<br />
Region 1970 1980 1990 2000<br />
1-A 24.9 17.2 12.7 9.3<br />
1-B 17.9 21.8 24.7 26.3<br />
1-C 8.2 10.0 11.2 10.7<br />
2 3.2 3.2 3.2 3.2<br />
3-A 2.1 2.0 2.1 2.2<br />
3-B 2.3 2.2 2.2 2.1<br />
3-C 1.2 1.2 1.2 1.2<br />
4 3.4 3.4 3.4 3.3<br />
5 5.1 5.2 5.4 5.7<br />
6 3.5 3.4 3.5 3.7<br />
7 7.1 7.6 7.6 8.0<br />
8 8.4 8.6 8.5 8.8<br />
9 2.4 3.0 3.3 3.7<br />
10 2.5 2.8 3.0 3.5<br />
11 4.7 4.7 4.4 4.2<br />
14 3.3 3.6 3.8 4.1<br />
While this loss <strong>in</strong> share is attributable, to some degree, to ga<strong>in</strong>s throughout the State, it is<br />
more the case <strong>of</strong> losses <strong>in</strong> Region 1-A. Table 2 shows population trends <strong>in</strong> Region 1-A,<br />
both total and just the 60 years and over population, from 1970 to 2000. Both groups<br />
suffered large losses, <strong>in</strong> both number and percent, between 1970 and 1980. While the<br />
region’s total population fell by 332,000, or 20.1 percent, the 60+ population dropped by<br />
over 56,000, or 17.2 percent. The decade <strong>of</strong> the 1980s brought a slight slow<strong>in</strong>g to the<br />
A <strong>Demographic</strong> <strong>Pr<strong>of</strong>ile</strong> <strong>of</strong> <strong>Senior</strong>s <strong>in</strong> PSA 1-A 5


