

Demographic Profile of Senior in Wayne County, Michigan
Demographic Profile of Senior in Wayne County, Michigan
Demographic Profile of Senior in Wayne County, Michigan

You also want an ePaper? Increase the reach of your titles
YUMPU automatically turns print PDFs into web optimized ePapers that Google loves.
Total Population Trends<br />
At the State level we have analyzed Region 1-C <strong>in</strong> relation to the other 15 regions <strong>in</strong> the<br />
State. This analysis has concentrated on the major factors <strong>of</strong>: share <strong>of</strong> State’s population<br />
60 years and over; share <strong>of</strong> State’s m<strong>in</strong>ority population 60 years and over; share <strong>of</strong><br />
State’s population 60 years and over <strong>in</strong> poverty. The analysis has shown that, while<br />
<strong>in</strong>creases <strong>in</strong> the region’s 60+ population resulted <strong>in</strong> an <strong>in</strong>crease <strong>in</strong> State share between<br />
1970 and 1990 (from 8.2 to 11.2 percent), the growth dur<strong>in</strong>g the 1990s did not keep up<br />
with overall State growth and resulted <strong>in</strong> a decrease <strong>in</strong> share from 11.2 to 10.7 percent.<br />
(Table 1)<br />
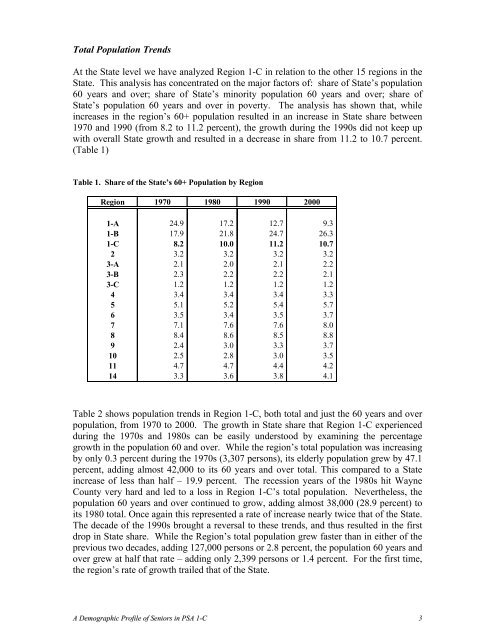
Table 1. Share <strong>of</strong> the State’s 60+ Population by Region<br />
Region 1970 1980 1990 2000<br />
1-A 24.9 17.2 12.7 9.3<br />
1-B 17.9 21.8 24.7 26.3<br />
1-C 8.2 10.0 11.2 10.7<br />
2 3.2 3.2 3.2 3.2<br />
3-A 2.1 2.0 2.1 2.2<br />
3-B 2.3 2.2 2.2 2.1<br />
3-C 1.2 1.2 1.2 1.2<br />
4 3.4 3.4 3.4 3.3<br />
5 5.1 5.2 5.4 5.7<br />
6 3.5 3.4 3.5 3.7<br />
7 7.1 7.6 7.6 8.0<br />
8 8.4 8.6 8.5 8.8<br />
9 2.4 3.0 3.3 3.7<br />
10 2.5 2.8 3.0 3.5<br />
11 4.7 4.7 4.4 4.2<br />
14 3.3 3.6 3.8 4.1<br />
Table 2 shows population trends <strong>in</strong> Region 1-C, both total and just the 60 years and over<br />
population, from 1970 to 2000. The growth <strong>in</strong> State share that Region 1-C experienced<br />
dur<strong>in</strong>g the 1970s and 1980s can be easily understood by exam<strong>in</strong><strong>in</strong>g the percentage<br />
growth <strong>in</strong> the population 60 and over. While the region’s total population was <strong>in</strong>creas<strong>in</strong>g<br />
by only 0.3 percent dur<strong>in</strong>g the 1970s (3,307 persons), its elderly population grew by 47.1<br />
percent, add<strong>in</strong>g almost 42,000 to its 60 years and over total. This compared to a State<br />
<strong>in</strong>crease <strong>of</strong> less than half – 19.9 percent. The recession years <strong>of</strong> the 1980s hit <strong>Wayne</strong><br />
<strong>County</strong> very hard and led to a loss <strong>in</strong> Region 1-C’s total population. Nevertheless, the<br />
population 60 years and over cont<strong>in</strong>ued to grow, add<strong>in</strong>g almost 38,000 (28.9 percent) to<br />
its 1980 total. Once aga<strong>in</strong> this represented a rate <strong>of</strong> <strong>in</strong>crease nearly twice that <strong>of</strong> the State.<br />
The decade <strong>of</strong> the 1990s brought a reversal to these trends, and thus resulted <strong>in</strong> the first<br />
drop <strong>in</strong> State share. While the Region’s total population grew faster than <strong>in</strong> either <strong>of</strong> the<br />
previous two decades, add<strong>in</strong>g 127,000 persons or 2.8 percent, the population 60 years and<br />
over grew at half that rate – add<strong>in</strong>g only 2,399 persons or 1.4 percent. For the first time,<br />
the region’s rate <strong>of</strong> growth trailed that <strong>of</strong> the State.<br />
A <strong>Demographic</strong> <strong>Pr<strong>of</strong>ile</strong> <strong>of</strong> <strong>Senior</strong>s <strong>in</strong> PSA 1-C 3


