

Demographic Profile of Senior in Wayne County, Michigan
Demographic Profile of Senior in Wayne County, Michigan
Demographic Profile of Senior in Wayne County, Michigan

You also want an ePaper? Increase the reach of your titles
YUMPU automatically turns print PDFs into web optimized ePapers that Google loves.
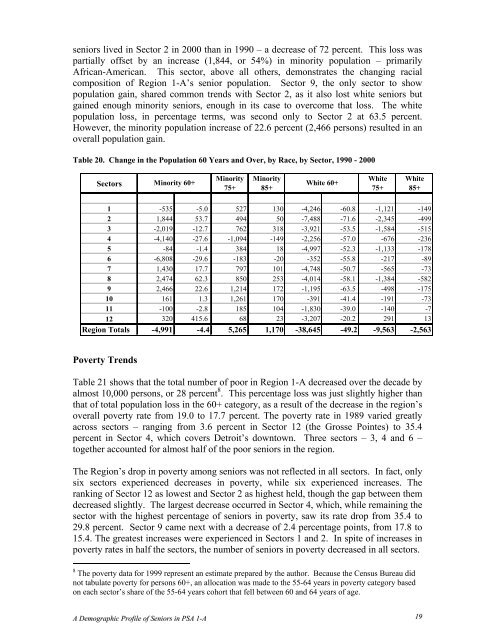
seniors lived <strong>in</strong> Sector 2 <strong>in</strong> 2000 than <strong>in</strong> 1990 – a decrease <strong>of</strong> 72 percent. This loss was<br />
partially <strong>of</strong>fset by an <strong>in</strong>crease (1,844, or 54%) <strong>in</strong> m<strong>in</strong>ority population – primarily<br />
African-American. This sector, above all others, demonstrates the chang<strong>in</strong>g racial<br />
composition <strong>of</strong> Region 1-A’s senior population. Sector 9, the only sector to show<br />
population ga<strong>in</strong>, shared common trends with Sector 2, as it also lost white seniors but<br />
ga<strong>in</strong>ed enough m<strong>in</strong>ority seniors, enough <strong>in</strong> its case to overcome that loss. The white<br />
population loss, <strong>in</strong> percentage terms, was second only to Sector 2 at 63.5 percent.<br />
However, the m<strong>in</strong>ority population <strong>in</strong>crease <strong>of</strong> 22.6 percent (2,466 persons) resulted <strong>in</strong> an<br />
overall population ga<strong>in</strong>.<br />
Table 20. Change <strong>in</strong> the Population 60 Years and Over, by Race, by Sector, 1990 - 2000<br />
Sectors<br />
M<strong>in</strong>ority M<strong>in</strong>ority<br />
M<strong>in</strong>ority 60+ White 60+<br />
75+ 85+<br />
White<br />
75+<br />
White<br />
85+<br />
1 -535 -5.0 527 130 -4,246 -60.8 -1,121 -149<br />
2 1,844 53.7 494 50 -7,488 -71.6 -2,345 -499<br />
3 -2,019 -12.7 762 318 -3,921 -53.5 -1,584 -515<br />
4 -4,140 -27.6 -1,094 -149 -2,256 -57.0 -676 -236<br />
5 -84 -1.4 384 18 -4,997 -52.3 -1,133 -178<br />
6 -6,808 -29.6 -183 -20 -352 -55.8 -217 -89<br />
7 1,430 17.7 797 101 -4,748 -50.7 -565 -73<br />
8 2,474 62.3 850 253 -4,014 -58.1 -1,384 -582<br />
9 2,466 22.6 1,214 172 -1,195 -63.5 -498 -175<br />
10 161 1.3 1,261 170 -391 -41.4 -191 -73<br />
11 -100 -2.8 185 104 -1,830 -39.0 -140 -7<br />
12 320 415.6 68 23 -3,207 -20.2 291 13<br />
Region Totals -4,991 -4.4 5,265 1,170 -38,645 -49.2 -9,563 -2,563<br />
Poverty Trends<br />
Table 21 shows that the total number <strong>of</strong> poor <strong>in</strong> Region 1-A decreased over the decade by<br />
almost 10,000 persons, or 28 percent 8 . This percentage loss was just slightly higher than<br />
that <strong>of</strong> total population loss <strong>in</strong> the 60+ category, as a result <strong>of</strong> the decrease <strong>in</strong> the region’s<br />
overall poverty rate from 19.0 to 17.7 percent. The poverty rate <strong>in</strong> 1989 varied greatly<br />
across sectors – rang<strong>in</strong>g from 3.6 percent <strong>in</strong> Sector 12 (the Grosse Po<strong>in</strong>tes) to 35.4<br />
percent <strong>in</strong> Sector 4, which covers Detroit’s downtown. Three sectors – 3, 4 and 6 –<br />
together accounted for almost half <strong>of</strong> the poor seniors <strong>in</strong> the region.<br />
The Region’s drop <strong>in</strong> poverty among seniors was not reflected <strong>in</strong> all sectors. In fact, only<br />
six sectors experienced decreases <strong>in</strong> poverty, while six experienced <strong>in</strong>creases. The<br />
rank<strong>in</strong>g <strong>of</strong> Sector 12 as lowest and Sector 2 as highest held, though the gap between them<br />
decreased slightly. The largest decrease occurred <strong>in</strong> Sector 4, which, while rema<strong>in</strong><strong>in</strong>g the<br />
sector with the highest percentage <strong>of</strong> seniors <strong>in</strong> poverty, saw its rate drop from 35.4 to<br />
29.8 percent. Sector 9 came next with a decrease <strong>of</strong> 2.4 percentage po<strong>in</strong>ts, from 17.8 to<br />
15.4. The greatest <strong>in</strong>creases were experienced <strong>in</strong> Sectors 1 and 2. In spite <strong>of</strong> <strong>in</strong>creases <strong>in</strong><br />
poverty rates <strong>in</strong> half the sectors, the number <strong>of</strong> seniors <strong>in</strong> poverty decreased <strong>in</strong> all sectors.<br />
8 The poverty data for 1999 represent an estimate prepared by the author. Because the Census Bureau did<br />
not tabulate poverty for persons 60+, an allocation was made to the 55-64 years <strong>in</strong> poverty category based<br />
on each sector’s share <strong>of</strong> the 55-64 years cohort that fell between 60 and 64 years <strong>of</strong> age.<br />
A <strong>Demographic</strong> <strong>Pr<strong>of</strong>ile</strong> <strong>of</strong> <strong>Senior</strong>s <strong>in</strong> PSA 1-A 19


