

Demographic Profile of Senior in Wayne County, Michigan
Demographic Profile of Senior in Wayne County, Michigan
Demographic Profile of Senior in Wayne County, Michigan

You also want an ePaper? Increase the reach of your titles
YUMPU automatically turns print PDFs into web optimized ePapers that Google loves.
River Rouge, Romulus and Sumpter township – have poverty rates exceed<strong>in</strong>g 10 percent.<br />
Fourteen communities, <strong>in</strong> addition to Rockwood, have rates less than 5 percent.<br />
When the poverty analysis moves up to the 150% threshold, all communities, with the<br />
exception <strong>of</strong> Allen Park, and the townships <strong>of</strong> Grosse Ile, Northville and Plymouth, have<br />
rates exceed<strong>in</strong>g 10 percent, with Belleville, Ecorse and Romulus shar<strong>in</strong>g the highest rate<br />
<strong>of</strong> 28 percent.<br />
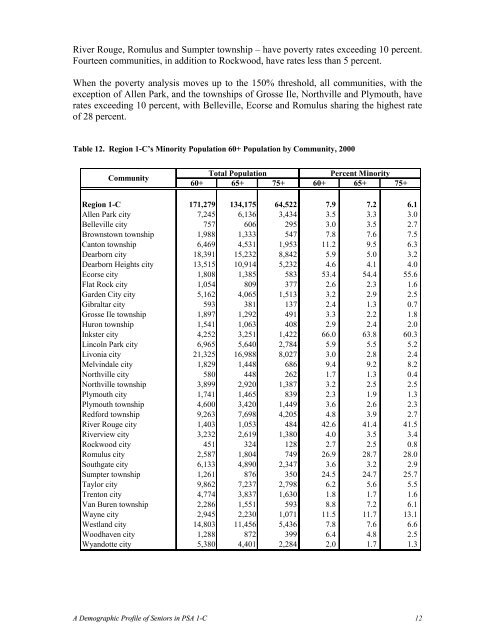
Table 12. Region 1-C’s M<strong>in</strong>ority Population 60+ Population by Community, 2000<br />
Community<br />
Total Population<br />
Percent M<strong>in</strong>ority<br />
60+ 65+ 75+ 60+ 65+ 75+<br />
Region 1-C 171,279 134,175 64,522 7.9 7.2 6.1<br />
Allen Park city 7,245 6,136 3,434 3.5 3.3 3.0<br />
Belleville city 757 606 295 3.0 3.5 2.7<br />
Brownstown township 1,988 1,333 547 7.8 7.6 7.5<br />
Canton township 6,469 4,531 1,953 11.2 9.5 6.3<br />
Dearborn city 18,391 15,232 8,842 5.9 5.0 3.2<br />
Dearborn Heights city 13,515 10,914 5,232 4.6 4.1 4.0<br />
Ecorse city 1,808 1,385 583 53.4 54.4 55.6<br />
Flat Rock city 1,054 809 377 2.6 2.3 1.6<br />
Garden City city 5,162 4,065 1,513 3.2 2.9 2.5<br />
Gibraltar city 593 381 137 2.4 1.3 0.7<br />
Grosse Ile township 1,897 1,292 491 3.3 2.2 1.8<br />
Huron township 1,541 1,063 408 2.9 2.4 2.0<br />
Inkster city 4,252 3,251 1,422 66.0 63.8 60.3<br />
L<strong>in</strong>coln Park city 6,965 5,640 2,784 5.9 5.5 5.2<br />
Livonia city 21,325 16,988 8,027 3.0 2.8 2.4<br />
Melv<strong>in</strong>dale city 1,829 1,448 686 9.4 9.2 8.2<br />
Northville city 580 448 262 1.7 1.3 0.4<br />
Northville township 3,899 2,920 1,387 3.2 2.5 2.5<br />
Plymouth city 1,741 1,465 839 2.3 1.9 1.3<br />
Plymouth township 4,600 3,420 1,449 3.6 2.6 2.3<br />
Redford township 9,263 7,698 4,205 4.8 3.9 2.7<br />
River Rouge city 1,403 1,053 484 42.6 41.4 41.5<br />
Riverview city 3,232 2,619 1,380 4.0 3.5 3.4<br />
Rockwood city 451 324 128 2.7 2.5 0.8<br />
Romulus city 2,587 1,804 749 26.9 28.7 28.0<br />
Southgate city 6,133 4,890 2,347 3.6 3.2 2.9<br />
Sumpter township 1,261 876 350 24.5 24.7 25.7<br />
Taylor city 9,862 7,237 2,798 6.2 5.6 5.5<br />
Trenton city 4,774 3,837 1,630 1.8 1.7 1.6<br />
Van Buren township 2,286 1,551 593 8.8 7.2 6.1<br />
<strong>Wayne</strong> city 2,945 2,230 1,071 11.5 11.7 13.1<br />
Westland city 14,803 11,456 5,436 7.8 7.6 6.6<br />
Woodhaven city 1,288 872 399 6.4 4.8 2.5<br />
Wyandotte city 5,380 4,401 2,284 2.0 1.7 1.3<br />
A <strong>Demographic</strong> <strong>Pr<strong>of</strong>ile</strong> <strong>of</strong> <strong>Senior</strong>s <strong>in</strong> PSA 1-C 12


