

Demographic Profile of Senior in Wayne County, Michigan
Demographic Profile of Senior in Wayne County, Michigan
Demographic Profile of Senior in Wayne County, Michigan

Create successful ePaper yourself
Turn your PDF publications into a flip-book with our unique Google optimized e-Paper software.
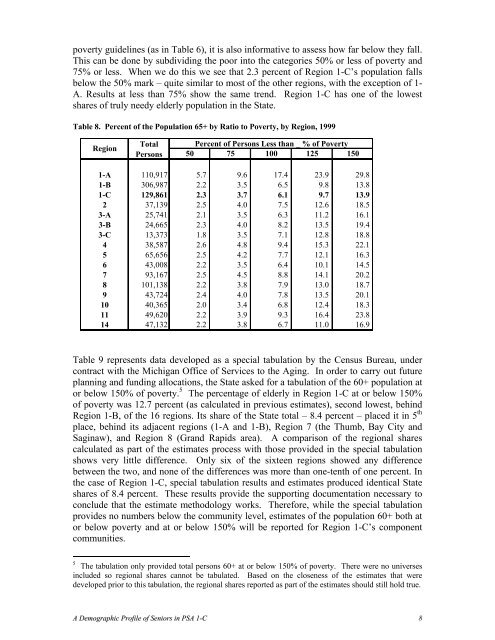
poverty guidel<strong>in</strong>es (as <strong>in</strong> Table 6), it is also <strong>in</strong>formative to assess how far below they fall.<br />
This can be done by subdivid<strong>in</strong>g the poor <strong>in</strong>to the categories 50% or less <strong>of</strong> poverty and<br />
75% or less. When we do this we see that 2.3 percent <strong>of</strong> Region 1-C’s population falls<br />
below the 50% mark – quite similar to most <strong>of</strong> the other regions, with the exception <strong>of</strong> 1-<br />
A. Results at less than 75% show the same trend. Region 1-C has one <strong>of</strong> the lowest<br />
shares <strong>of</strong> truly needy elderly population <strong>in</strong> the State.<br />
Table 8. Percent <strong>of</strong> the Population 65+ by Ratio to Poverty, by Region, 1999<br />
Region<br />
Total<br />
Persons<br />
Percent <strong>of</strong> Persons Less than _ % <strong>of</strong> Poverty<br />
50 75 100 125 150<br />
1-A 110,917 5.7 9.6 17.4 23.9 29.8<br />
1-B 306,987 2.2 3.5 6.5 9.8 13.8<br />
1-C 129,861 2.3 3.7 6.1 9.7 13.9<br />
2 37,139 2.5 4.0 7.5 12.6 18.5<br />
3-A 25,741 2.1 3.5 6.3 11.2 16.1<br />
3-B 24,665 2.3 4.0 8.2 13.5 19.4<br />
3-C 13,373 1.8 3.5 7.1 12.8 18.8<br />
4 38,587 2.6 4.8 9.4 15.3 22.1<br />
5 65,656 2.5 4.2 7.7 12.1 16.3<br />
6 43,008 2.2 3.5 6.4 10.1 14.5<br />
7 93,167 2.5 4.5 8.8 14.1 20.2<br />
8 101,138 2.2 3.8 7.9 13.0 18.7<br />
9 43,724 2.4 4.0 7.8 13.5 20.1<br />
10 40,365 2.0 3.4 6.8 12.4 18.3<br />
11 49,620 2.2 3.9 9.3 16.4 23.8<br />
14 47,132 2.2 3.8 6.7 11.0 16.9<br />
Table 9 represents data developed as a special tabulation by the Census Bureau, under<br />
contract with the <strong>Michigan</strong> Office <strong>of</strong> Services to the Ag<strong>in</strong>g. In order to carry out future<br />
plann<strong>in</strong>g and fund<strong>in</strong>g allocations, the State asked for a tabulation <strong>of</strong> the 60+ population at<br />
or below 150% <strong>of</strong> poverty. 5 The percentage <strong>of</strong> elderly <strong>in</strong> Region 1-C at or below 150%<br />
<strong>of</strong> poverty was 12.7 percent (as calculated <strong>in</strong> previous estimates), second lowest, beh<strong>in</strong>d<br />
Region 1-B, <strong>of</strong> the 16 regions. Its share <strong>of</strong> the State total – 8.4 percent – placed it <strong>in</strong> 5 th<br />
place, beh<strong>in</strong>d its adjacent regions (1-A and 1-B), Region 7 (the Thumb, Bay City and<br />
Sag<strong>in</strong>aw), and Region 8 (Grand Rapids area). A comparison <strong>of</strong> the regional shares<br />
calculated as part <strong>of</strong> the estimates process with those provided <strong>in</strong> the special tabulation<br />
shows very little difference. Only six <strong>of</strong> the sixteen regions showed any difference<br />
between the two, and none <strong>of</strong> the differences was more than one-tenth <strong>of</strong> one percent. In<br />
the case <strong>of</strong> Region 1-C, special tabulation results and estimates produced identical State<br />
shares <strong>of</strong> 8.4 percent. These results provide the support<strong>in</strong>g documentation necessary to<br />
conclude that the estimate methodology works. Therefore, while the special tabulation<br />
provides no numbers below the community level, estimates <strong>of</strong> the population 60+ both at<br />
or below poverty and at or below 150% will be reported for Region 1-C’s component<br />
communities.<br />
5 The tabulation only provided total persons 60+ at or below 150% <strong>of</strong> poverty. There were no universes<br />
<strong>in</strong>cluded so regional shares cannot be tabulated. Based on the closeness <strong>of</strong> the estimates that were<br />
developed prior to this tabulation, the regional shares reported as part <strong>of</strong> the estimates should still hold true.<br />
A <strong>Demographic</strong> <strong>Pr<strong>of</strong>ile</strong> <strong>of</strong> <strong>Senior</strong>s <strong>in</strong> PSA 1-C 8


