

Demographic Profile of Senior in Wayne County, Michigan
Demographic Profile of Senior in Wayne County, Michigan
Demographic Profile of Senior in Wayne County, Michigan

Create successful ePaper yourself
Turn your PDF publications into a flip-book with our unique Google optimized e-Paper software.
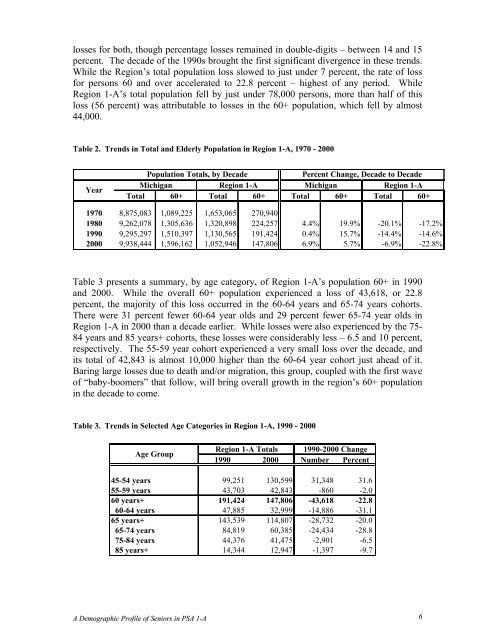
losses for both, though percentage losses rema<strong>in</strong>ed <strong>in</strong> double-digits – between 14 and 15<br />
percent. The decade <strong>of</strong> the 1990s brought the first significant divergence <strong>in</strong> these trends.<br />
While the Region’s total population loss slowed to just under 7 percent, the rate <strong>of</strong> loss<br />
for persons 60 and over accelerated to 22.8 percent – highest <strong>of</strong> any period. While<br />
Region 1-A’s total population fell by just under 78,000 persons, more than half <strong>of</strong> this<br />
loss (56 percent) was attributable to losses <strong>in</strong> the 60+ population, which fell by almost<br />
44,000.<br />
Table 2. Trends <strong>in</strong> Total and Elderly Population <strong>in</strong> Region 1-A, 1970 - 2000<br />
Year<br />
Population Totals, by Decade<br />
Percent Change, Decade to Decade<br />
<strong>Michigan</strong> Region 1-A <strong>Michigan</strong> Region 1-A<br />
Total 60+ Total 60+ Total 60+ Total 60+<br />
1970 8,875,083 1,089,225 1,653,065 270,940<br />
1980 9,262,078 1,305,636 1,320,898 224,257 4.4% 19.9% -20.1% -17.2%<br />
1990 9,295,297 1,510,397 1,130,565 191,424 0.4% 15.7% -14.4% -14.6%<br />
2000 9,938,444 1,596,162 1,052,946 147,806 6.9% 5.7% -6.9% -22.8%<br />
Table 3 presents a summary, by age category, <strong>of</strong> Region 1-A’s population 60+ <strong>in</strong> 1990<br />
and 2000. While the overall 60+ population experienced a loss <strong>of</strong> 43,618, or 22.8<br />
percent, the majority <strong>of</strong> this loss occurred <strong>in</strong> the 60-64 years and 65-74 years cohorts.<br />
There were 31 percent fewer 60-64 year olds and 29 percent fewer 65-74 year olds <strong>in</strong><br />
Region 1-A <strong>in</strong> 2000 than a decade earlier. While losses were also experienced by the 75-<br />
84 years and 85 years+ cohorts, these losses were considerably less – 6.5 and 10 percent,<br />
respectively. The 55-59 year cohort experienced a very small loss over the decade, and<br />
its total <strong>of</strong> 42,843 is almost 10,000 higher than the 60-64 year cohort just ahead <strong>of</strong> it.<br />
Bar<strong>in</strong>g large losses due to death and/or migration, this group, coupled with the first wave<br />
<strong>of</strong> “baby-boomers” that follow, will br<strong>in</strong>g overall growth <strong>in</strong> the region’s 60+ population<br />
<strong>in</strong> the decade to come.<br />
Table 3. Trends <strong>in</strong> Selected Age Categories <strong>in</strong> Region 1-A, 1990 - 2000<br />
Age Group<br />
Region 1-A Totals 1990-2000 Change<br />
1990 2000 Number Percent<br />
45-54 years 99,251 130,599 31,348 31.6<br />
55-59 years 43,703 42,843 -860 -2.0<br />
60 years+ 191,424 147,806 -43,618 -22.8<br />
60-64 years 47,885 32,999 -14,886 -31.1<br />
65 years+ 143,539 114,807 -28,732 -20.0<br />
65-74 years 84,819 60,385 -24,434 -28.8<br />
75-84 years 44,376 41,475 -2,901 -6.5<br />
85 years+ 14,344 12,947 -1,397 -9.7<br />
A <strong>Demographic</strong> <strong>Pr<strong>of</strong>ile</strong> <strong>of</strong> <strong>Senior</strong>s <strong>in</strong> PSA 1-A 6


