

Demographic Profile of Senior in Wayne County, Michigan
Demographic Profile of Senior in Wayne County, Michigan
Demographic Profile of Senior in Wayne County, Michigan

You also want an ePaper? Increase the reach of your titles
YUMPU automatically turns print PDFs into web optimized ePapers that Google loves.
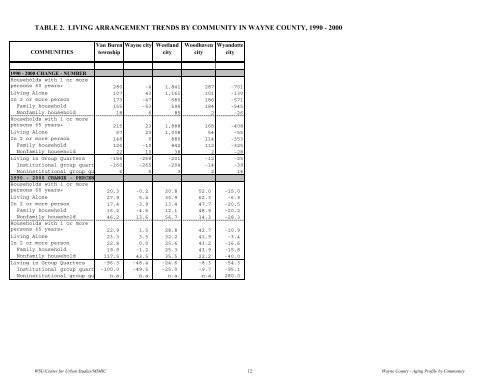
TABLE 2. LIVING ARRANGEMENT TRENDS BY COMMUNITY IN WAYNE COUNTY, 1990 - 2000<br />
COMMUNITIES<br />
Van Buren<br />
township<br />
<strong>Wayne</strong> city Westland<br />
city<br />
Woodhaven<br />
city<br />
Wyandotte<br />
city<br />
1990 - 2000 CHANGE - NUMBER<br />
Households with 1 or more<br />
persons 60 years+<br />
Liv<strong>in</strong>g Alone<br />
In 2 or more person<br />
Family household<br />
Nonfamily household<br />
Households with 1 or more<br />
persons 65 years+<br />
Liv<strong>in</strong>g Alone<br />
In 2 or more person<br />
Family household<br />
Nonfamily household<br />
Liv<strong>in</strong>g <strong>in</strong> Group Quarters<br />
Institutional group quart<br />
Non<strong>in</strong>stitutional group qu<br />
1990 - 2000 CHANGE - PERCENT<br />
Households with 1 or more<br />
persons 60 years+<br />
Liv<strong>in</strong>g Alone<br />
In 2 or more person<br />
Family household<br />
Nonfamily household<br />
Households with 1 or more<br />
persons 65 years+<br />
Liv<strong>in</strong>g Alone<br />
In 2 or more person<br />
Family household<br />
Nonfamily household<br />
Liv<strong>in</strong>g <strong>in</strong> Group Quarters<br />
Institutional group quart<br />
Non<strong>in</strong>stitutional group qu<br />
280 -4 1,841 287 -701<br />
107 43 1,161 101 -130<br />
173 -47 680 186 -571<br />
155 -53 595 184 -545<br />
18 6 85 2 -26<br />
215 23 1,888 168 -408<br />
67 23 1,008 54 -55<br />
148 0 880 114 -353<br />
126 -10 842 112 -325<br />
22 10 38 2 -28<br />
-154 -259 -201 -12 -25<br />
-160 -265 -204 -14 -39<br />
6 6 3 2 14<br />
20.3 -0.2 20.8 52.0 -15.0<br />
27.9 5.4 30.9 62.3 -6.9<br />
17.4 -3.9 13.4 47.7 -20.5<br />
16.2 -4.6 12.1 48.9 -20.2<br />
46.2 13.6 56.7 14.3 -28.3<br />
22.9 1.5 28.8 42.7 -10.9<br />
23.3 3.5 32.2 41.9 -3.4<br />
22.8 0.0 25.6 43.2 -16.6<br />
19.9 -1.2 25.3 43.9 -15.8<br />
137.5 43.5 35.5 22.2 -40.0<br />
-96.3 -48.4 -24.6 -8.3 -54.3<br />
-100.0 -49.5 -25.0 -9.7 -95.1<br />
n.a. n.a. n.a. n.a. 280.0<br />
WSU/Center for Urban Studies/MIMIC 12 <strong>Wayne</strong> <strong>County</strong> - Ag<strong>in</strong>g <strong>Pr<strong>of</strong>ile</strong> by Community


