

Demographic Profile of Senior in Wayne County, Michigan
Demographic Profile of Senior in Wayne County, Michigan
Demographic Profile of Senior in Wayne County, Michigan

You also want an ePaper? Increase the reach of your titles
YUMPU automatically turns print PDFs into web optimized ePapers that Google loves.
The east side <strong>of</strong> the City experienced very different results. Sectors 1, 2 and 3 all lost<br />
better than one-forth <strong>of</strong> their senior population, as did Sector 4, which encompasses the<br />
downtown core. Significant losses also occurred <strong>in</strong> Sector 5 <strong>in</strong> southwest Detroit, where<br />
an <strong>in</strong>creas<strong>in</strong>gly younger Hispanic population is replac<strong>in</strong>g older residents, and <strong>in</strong> Sector 6<br />
<strong>in</strong> the central corridor <strong>of</strong> the city. Because the percentage loss <strong>in</strong> each <strong>of</strong> these areas<br />
exceeded that <strong>of</strong> the region as a whole, their shares <strong>of</strong> the regional total also fell. While<br />
significant losses also occurred <strong>in</strong> the non-Detroit Sectors 11 and 12, the percentage loss<br />
<strong>in</strong> 11 mirrored that <strong>of</strong> the region, thus leav<strong>in</strong>g its share unchanged, while that <strong>in</strong> 12 was<br />
less than that <strong>of</strong> the region lead<strong>in</strong>g to <strong>in</strong>crease <strong>in</strong> its share from 8.3 to 8.8 percent.<br />
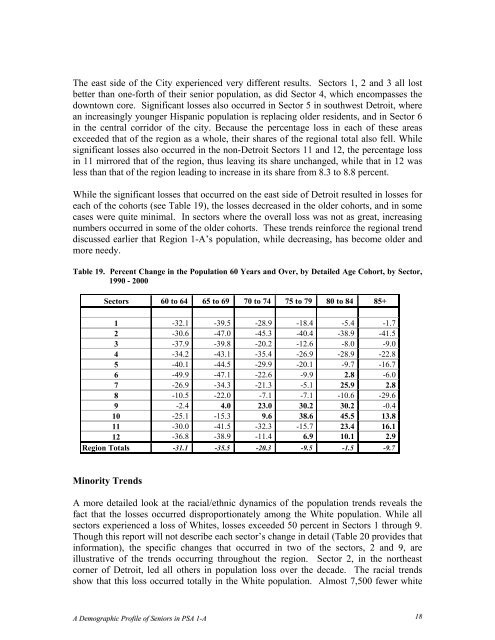
While the significant losses that occurred on the east side <strong>of</strong> Detroit resulted <strong>in</strong> losses for<br />
each <strong>of</strong> the cohorts (see Table 19), the losses decreased <strong>in</strong> the older cohorts, and <strong>in</strong> some<br />
cases were quite m<strong>in</strong>imal. In sectors where the overall loss was not as great, <strong>in</strong>creas<strong>in</strong>g<br />
numbers occurred <strong>in</strong> some <strong>of</strong> the older cohorts. These trends re<strong>in</strong>force the regional trend<br />
discussed earlier that Region 1-A’s population, while decreas<strong>in</strong>g, has become older and<br />
more needy.<br />
Table 19. Percent Change <strong>in</strong> the Population 60 Years and Over, by Detailed Age Cohort, by Sector,<br />
1990 - 2000<br />
Sectors 60 to 64 65 to 69 70 to 74 75 to 79 80 to 84 85+<br />
1 -32.1 -39.5 -28.9 -18.4 -5.4 -1.7<br />
2 -30.6 -47.0 -45.3 -40.4 -38.9 -41.5<br />
3 -37.9 -39.8 -20.2 -12.6 -8.0 -9.0<br />
4 -34.2 -43.1 -35.4 -26.9 -28.9 -22.8<br />
5 -40.1 -44.5 -29.9 -20.1 -9.7 -16.7<br />
6 -49.9 -47.1 -22.6 -9.9 2.8 -6.0<br />
7 -26.9 -34.3 -21.3 -5.1 25.9 2.8<br />
8 -10.5 -22.0 -7.1 -7.1 -10.6 -29.6<br />
9 -2.4 4.0 23.0 30.2 30.2 -0.4<br />
10 -25.1 -15.3 9.6 38.6 45.5 13.8<br />
11 -30.0 -41.5 -32.3 -15.7 23.4 16.1<br />
12 -36.8 -38.9 -11.4 6.9 10.1 2.9<br />
Region Totals -31.1 -35.5 -20.3 -9.5 -1.5 -9.7<br />
M<strong>in</strong>ority Trends<br />
A more detailed look at the racial/ethnic dynamics <strong>of</strong> the population trends reveals the<br />
fact that the losses occurred disproportionately among the White population. While all<br />
sectors experienced a loss <strong>of</strong> Whites, losses exceeded 50 percent <strong>in</strong> Sectors 1 through 9.<br />
Though this report will not describe each sector’s change <strong>in</strong> detail (Table 20 provides that<br />
<strong>in</strong>formation), the specific changes that occurred <strong>in</strong> two <strong>of</strong> the sectors, 2 and 9, are<br />
illustrative <strong>of</strong> the trends occurr<strong>in</strong>g throughout the region. Sector 2, <strong>in</strong> the northeast<br />
corner <strong>of</strong> Detroit, led all others <strong>in</strong> population loss over the decade. The racial trends<br />
show that this loss occurred totally <strong>in</strong> the White population. Almost 7,500 fewer white<br />
A <strong>Demographic</strong> <strong>Pr<strong>of</strong>ile</strong> <strong>of</strong> <strong>Senior</strong>s <strong>in</strong> PSA 1-A 18


