

Demographic Profile of Senior in Wayne County, Michigan
Demographic Profile of Senior in Wayne County, Michigan
Demographic Profile of Senior in Wayne County, Michigan

Create successful ePaper yourself
Turn your PDF publications into a flip-book with our unique Google optimized e-Paper software.
A <strong>Demographic</strong> <strong>Pr<strong>of</strong>ile</strong> <strong>of</strong> <strong>Senior</strong>s <strong>in</strong> PSA 1-A:<br />
Implications for Fund<strong>in</strong>g and Service Delivery<br />
Key F<strong>in</strong>d<strong>in</strong>gs<br />
PSA 1-A conta<strong>in</strong>ed one <strong>of</strong> every four (24.9 percent) <strong>Michigan</strong> seniors <strong>in</strong> 1970, but less<br />
than one <strong>in</strong> ten (9.3 percent) resided there as <strong>of</strong> 2000. While general population trends <strong>in</strong><br />
the state would predict such a shift, the 1990’s brought a variation <strong>in</strong> the region’s trend<br />
that is both disturb<strong>in</strong>g and, unfortunately, not fully understandable. The rate <strong>of</strong> loss for<br />
seniors mirrored that <strong>of</strong> the general population dur<strong>in</strong>g the 1970s and 1980s. In the 1990s,<br />
however, a large variance occurred. While the rate <strong>of</strong> loss for the general population<br />
slowed to half that <strong>of</strong> the 1980’s (6.9 vs. 14.4 percent), the rate <strong>of</strong> loss for seniors<br />
accelerated (22.8 vs. 14.6 percent), outdistanc<strong>in</strong>g the general population loss by a factor<br />
<strong>of</strong> three.<br />
There are three potential reasons for such loss.<br />
1. A companion study, “Health Status <strong>of</strong> <strong>Senior</strong>s: Implications for Fund<strong>in</strong>g and<br />
Service Delivery,” describes the impact <strong>of</strong> excess deaths <strong>in</strong> PSA 1-A. This is<br />
certa<strong>in</strong>ly a major factor <strong>in</strong> the decl<strong>in</strong><strong>in</strong>g population <strong>of</strong> seniors <strong>in</strong> PSA 1-A, but<br />
does not fully expla<strong>in</strong> the change that occurred dur<strong>in</strong>g the 1990’s.<br />
2. A second factor, and one for which data have yet to be released from the 2000<br />
Census, is that <strong>of</strong> out-migration. While one anticipates a general movement <strong>of</strong><br />
seniors out-<strong>of</strong>-state, particularly to the South and West, it is also a fact that the<br />
growth <strong>in</strong> PSA 1-B, a region which encompasses the counties immediately north<br />
<strong>of</strong> the Detroit city limits, was driven, <strong>in</strong> part, by the movement <strong>of</strong> seniors out <strong>of</strong> 1-<br />
A. An analysis <strong>of</strong> the 2000 Census Public Use Microdata file estimates<br />
movement <strong>of</strong> almost 5,000 seniors from <strong>Wayne</strong> <strong>County</strong> <strong>in</strong>to Macomb <strong>County</strong><br />
between 1995 and 2000. While we are unable to determ<strong>in</strong>e whether all 5,000<br />
lived specifically <strong>in</strong> PSA 1-A <strong>in</strong> 1995, general migration patterns over the year<br />
would suggest that the vast majority did. An additional 5,500 are estimated to<br />
have moved to Oakland <strong>County</strong>, and almost 6,000 to other areas <strong>in</strong> southeast<br />
<strong>Michigan</strong> (more likely affect<strong>in</strong>g PSA 1-C as well).<br />
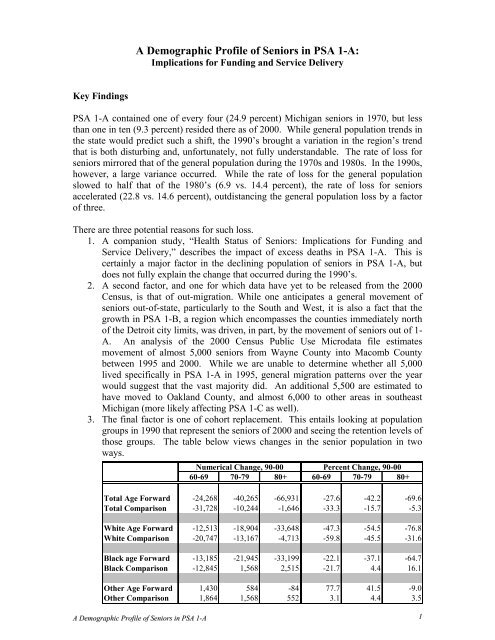
3. The f<strong>in</strong>al factor is one <strong>of</strong> cohort replacement. This entails look<strong>in</strong>g at population<br />
groups <strong>in</strong> 1990 that represent the seniors <strong>of</strong> 2000 and see<strong>in</strong>g the retention levels <strong>of</strong><br />
those groups. The table below views changes <strong>in</strong> the senior population <strong>in</strong> two<br />
ways.<br />
Numerical Change, 90-00 Percent Change, 90-00<br />
60-69 70-79 80+ 60-69 70-79 80+<br />
Total Age Forward -24,268 -40,265 -66,931 -27.6 -42.2 -69.6<br />
Total Comparison -31,728 -10,244 -1,646 -33.3 -15.7 -5.3<br />
White Age Forward -12,513 -18,904 -33,648 -47.3 -54.5 -76.8<br />
White Comparison -20,747 -13,167 -4,713 -59.8 -45.5 -31.6<br />
Black age Forward -13,185 -21,945 -33,199 -22.1 -37.1 -64.7<br />
Black Comparison -12,845 1,568 2,515 -21.7 4.4 16.1<br />
Other Age Forward 1,430 584 -84 77.7 41.5 -9.0<br />
Other Comparison 1,864 1,568 552 3.1 4.4 3.5<br />
A <strong>Demographic</strong> <strong>Pr<strong>of</strong>ile</strong> <strong>of</strong> <strong>Senior</strong>s <strong>in</strong> PSA 1-A 1


