

Demographic Profile of Senior in Wayne County, Michigan
Demographic Profile of Senior in Wayne County, Michigan
Demographic Profile of Senior in Wayne County, Michigan

You also want an ePaper? Increase the reach of your titles
YUMPU automatically turns print PDFs into web optimized ePapers that Google loves.
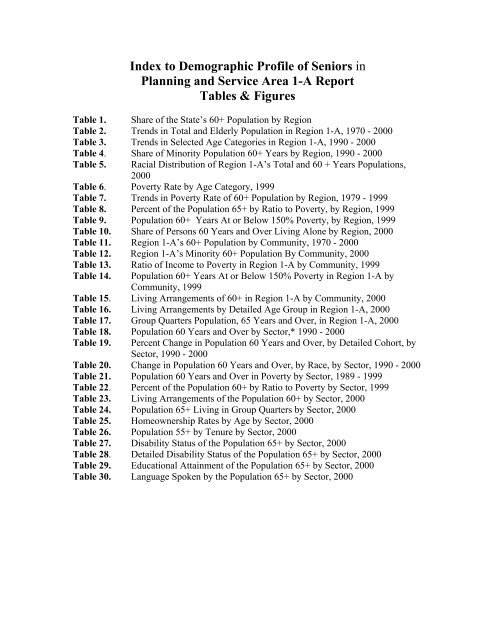
Index to <strong>Demographic</strong> <strong>Pr<strong>of</strong>ile</strong> <strong>of</strong> <strong>Senior</strong>s <strong>in</strong><br />
Plann<strong>in</strong>g and Service Area 1-A Report<br />
Tables & Figures<br />
Table 1. Share <strong>of</strong> the State’s 60+ Population by Region<br />
Table 2. Trends <strong>in</strong> Total and Elderly Population <strong>in</strong> Region 1-A, 1970 - 2000<br />
Table 3. Trends <strong>in</strong> Selected Age Categories <strong>in</strong> Region 1-A, 1990 - 2000<br />
Table 4. Share <strong>of</strong> M<strong>in</strong>ority Population 60+ Years by Region, 1990 - 2000<br />
Table 5. Racial Distribution <strong>of</strong> Region 1-A’s Total and 60 + Years Populations,<br />
2000<br />
Table 6. Poverty Rate by Age Category, 1999<br />
Table 7. Trends <strong>in</strong> Poverty Rate <strong>of</strong> 60+ Population by Region, 1979 - 1999<br />
Table 8. Percent <strong>of</strong> the Population 65+ by Ratio to Poverty, by Region, 1999<br />
Table 9. Population 60+ Years At or Below 150% Poverty, by Region, 1999<br />
Table 10. Share <strong>of</strong> Persons 60 Years and Over Liv<strong>in</strong>g Alone by Region, 2000<br />
Table 11. Region 1-A’s 60+ Population by Community, 1970 - 2000<br />
Table 12. Region 1-A’s M<strong>in</strong>ority 60+ Population By Community, 2000<br />
Table 13. Ratio <strong>of</strong> Income to Poverty <strong>in</strong> Region 1-A by Community, 1999<br />
Table 14. Population 60+ Years At or Below 150% Poverty <strong>in</strong> Region 1-A by<br />
Community, 1999<br />
Table 15. Liv<strong>in</strong>g Arrangements <strong>of</strong> 60+ <strong>in</strong> Region 1-A by Community, 2000<br />
Table 16. Liv<strong>in</strong>g Arrangements by Detailed Age Group <strong>in</strong> Region 1-A, 2000<br />
Table 17. Group Quarters Population, 65 Years and Over, <strong>in</strong> Region 1-A, 2000<br />
Table 18. Population 60 Years and Over by Sector,* 1990 - 2000<br />
Table 19.<br />
Percent Change <strong>in</strong> Population 60 Years and Over, by Detailed Cohort, by<br />
Sector, 1990 - 2000<br />
Table 20. Change <strong>in</strong> Population 60 Years and Over, by Race, by Sector, 1990 - 2000<br />
Table 21. Population 60 Years and Over <strong>in</strong> Poverty by Sector, 1989 - 1999<br />
Table 22. Percent <strong>of</strong> the Population 60+ by Ratio to Poverty by Sector, 1999<br />
Table 23. Liv<strong>in</strong>g Arrangements <strong>of</strong> the Population 60+ by Sector, 2000<br />
Table 24. Population 65+ Liv<strong>in</strong>g <strong>in</strong> Group Quarters by Sector, 2000<br />
Table 25. Homeownership Rates by Age by Sector, 2000<br />
Table 26. Population 55+ by Tenure by Sector, 2000<br />
Table 27. Disability Status <strong>of</strong> the Population 65+ by Sector, 2000<br />
Table 28. Detailed Disability Status <strong>of</strong> the Population 65+ by Sector, 2000<br />
Table 29. Educational Atta<strong>in</strong>ment <strong>of</strong> the Population 65+ by Sector, 2000<br />
Table 30. Language Spoken by the Population 65+ by Sector, 2000


